Business Intelligence Reports
The Analytics tool in the Subscription Commerce Manager allows you to view and configure the reports saved in your Business Intelligence bookmarks. The following explains how to use the feature and manage the BiReports dashboard.
Important
You can only add reports to your Reports dashboard that are saved as bookmarks in the Business Intelligence account. To learn how to set up bookmarks in the Business Intelligence, see Work with Bookmarks.
Add Reports to the Subscription Commerce Manager
- In the main menu, click Analytics > BI Bookmarks. A window opens that displays your Reports dashboard.
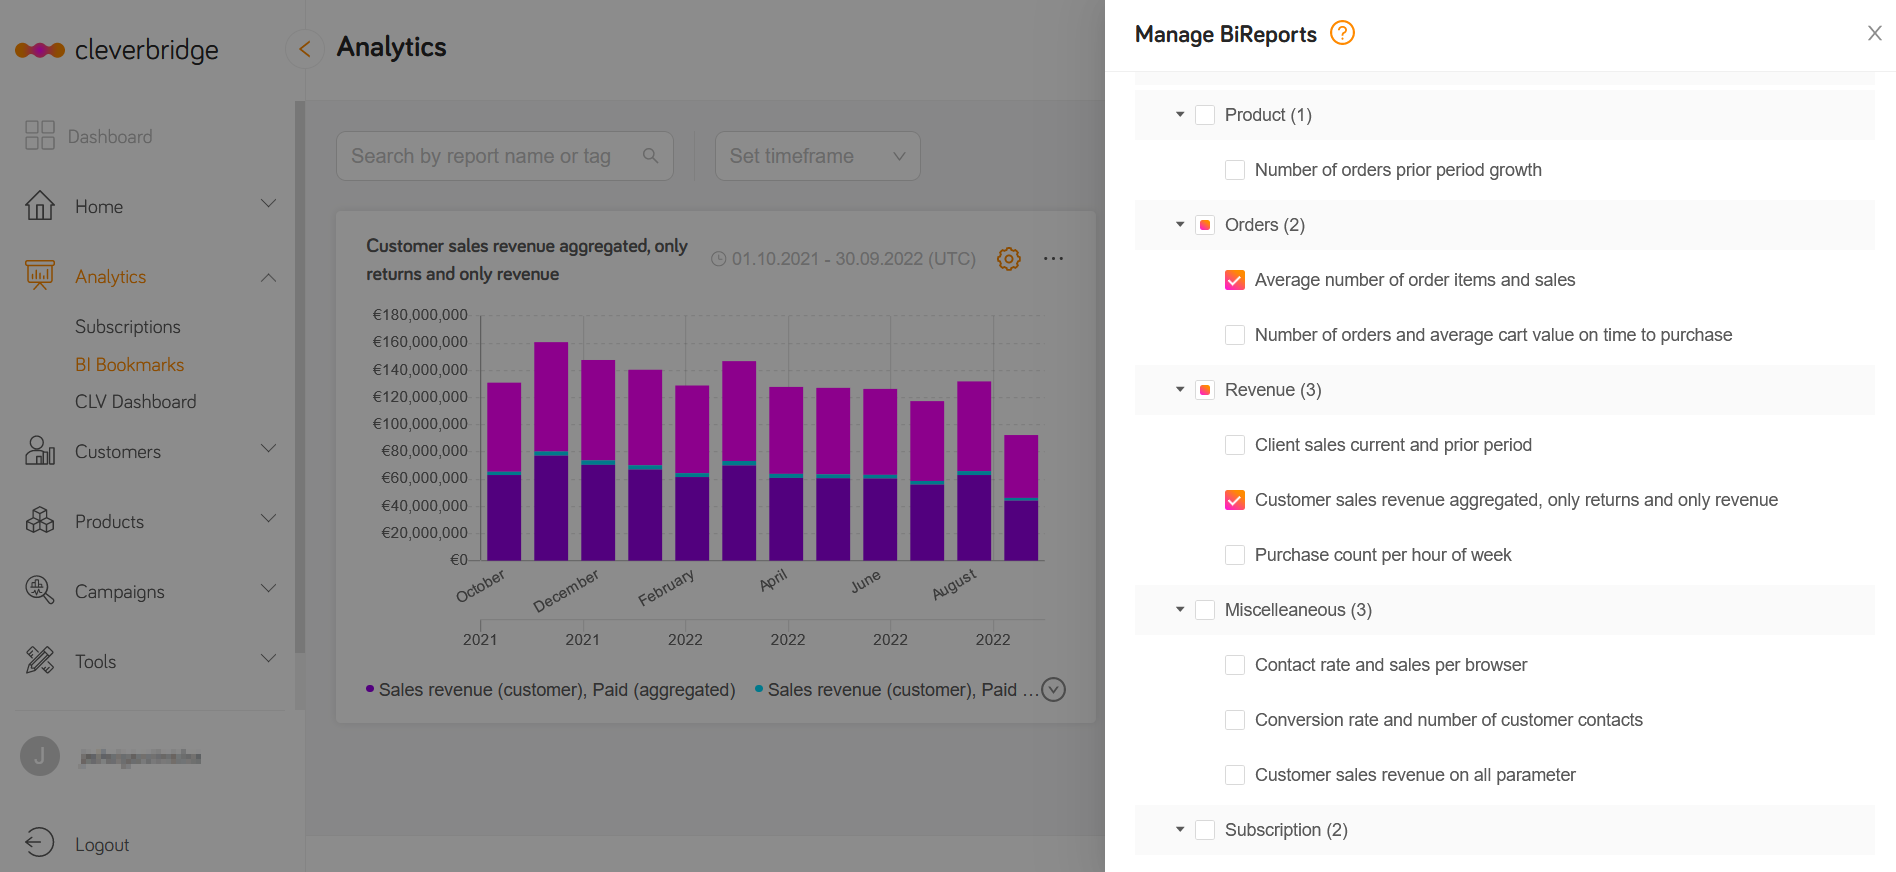
- Click Manage BiReports to create your Reports dashboard. A side window opens with the reports saved in your BI bookmarks.
- Complete one of the following:
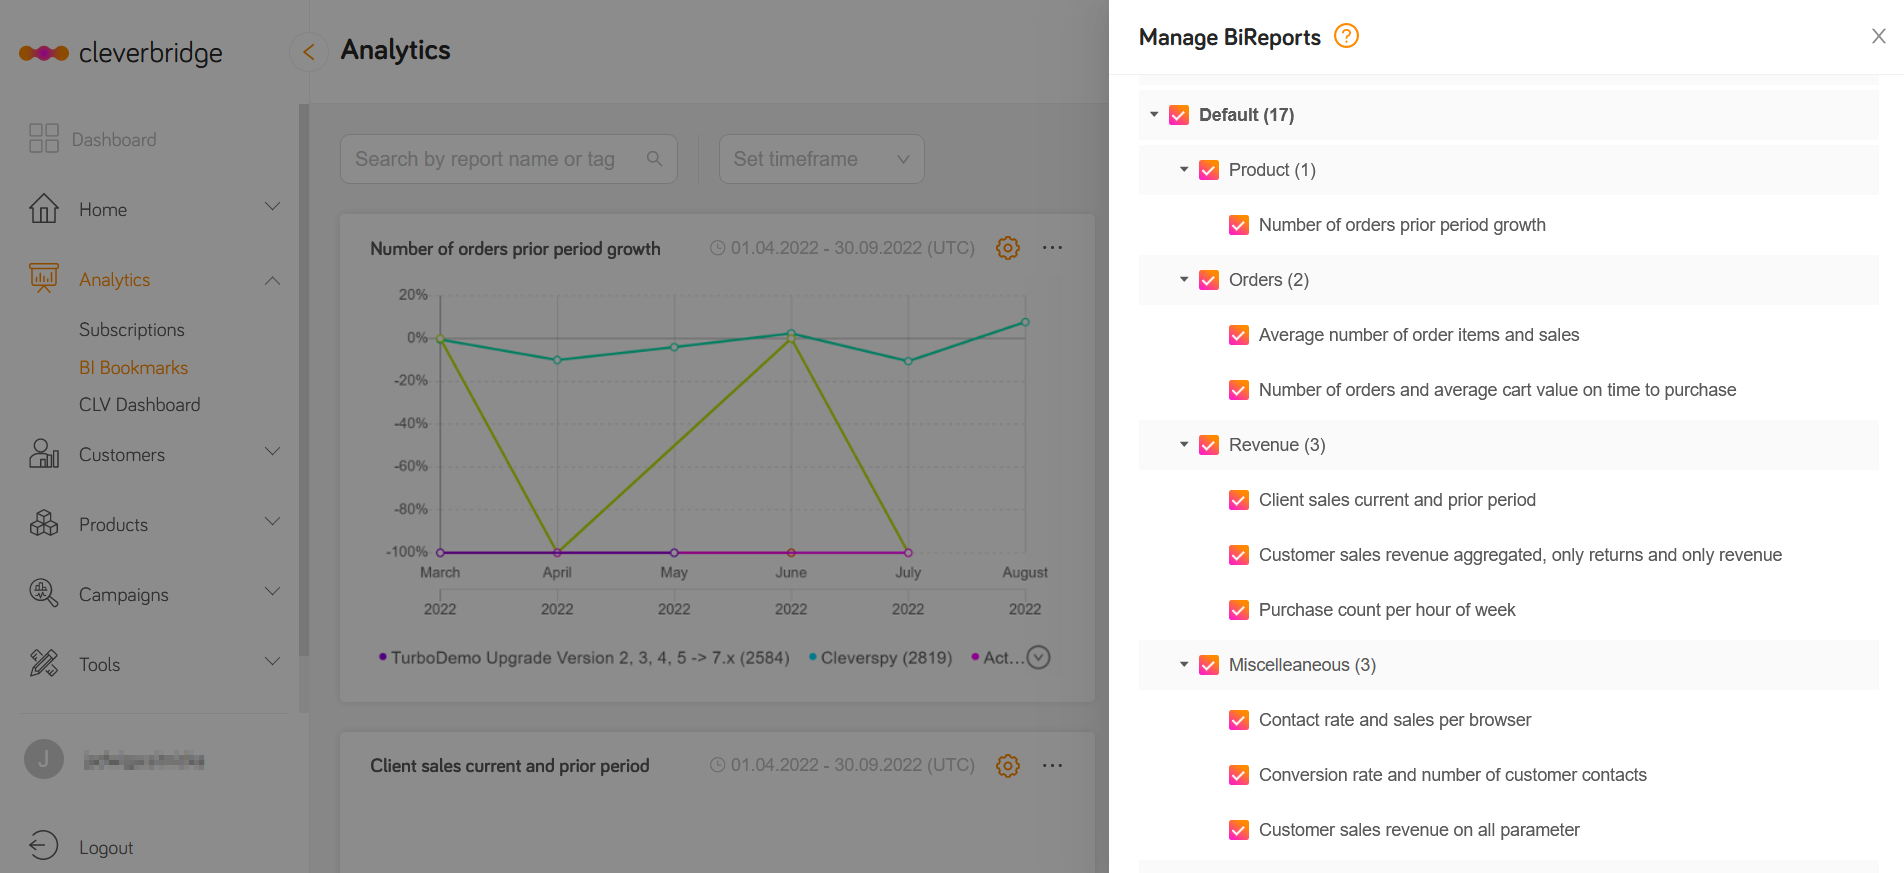
- Search for reports by name or tag. After all reports for the selected name or tag appear, select the reports you would like to add to your dashboard using the checkboxes. The selected reports will appear on your Dashboard.
- Search for reports by name or tag. After all reports for the selected name or tag appear, select the folder containing the reports you would like to add to your Dashboard. All reports in the selected folder will appear on your Dashboard.

- Search for reports by name or tag. After all reports for the selected name or tag appear, select the reports you would like to add to your dashboard using the checkboxes. The selected reports will appear on your Dashboard.

Configure the Reports on Your Dashboard
- In the main menu, click Analytics > BI Bookmarks. Your Reports dashboard opens.
- Click the ⚙ button on the upper-right side of the report that you want to configure. The Settings panel opens.
- Configure the report using the following options:
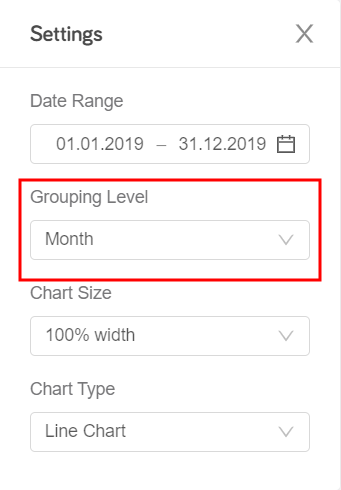
 Grouping Level
Change the level of data granularity in your report. You can display data per Hour, Day, Week, Month, or Quarter. In the following example, the data will be displayed per month.
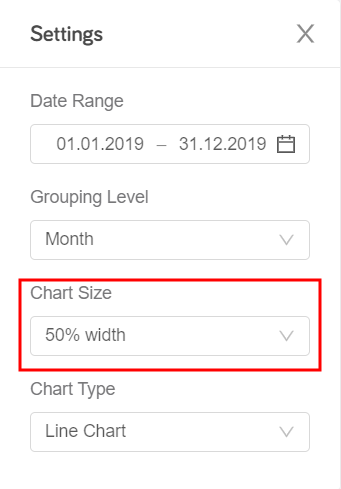
 Set chart size
Change the display size of a Line Graph, Pie Chart, or Bar Chart. You can choose 30% width, 50% width, or 100% width. The default size is 50% width.
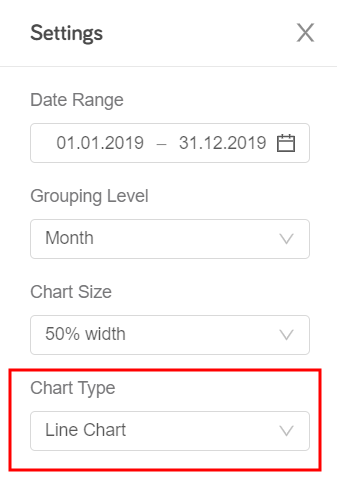
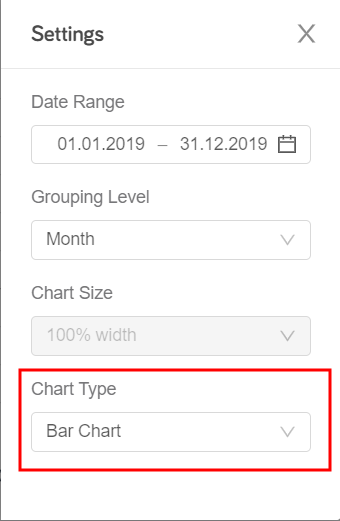
 Chart type
Change the way in which your report data is displayed. You can choose Line Chart, Pie Chart, Bar Chart, or Table.
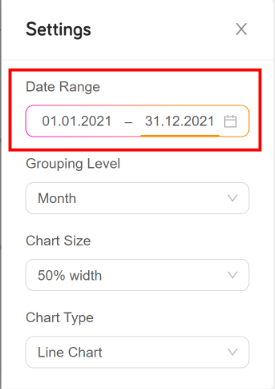
 Set Date Range
Change the date range for which you want to display your reporting data. To do so, you have three options:
- If you do not select a specific timeframe under Date Range, the default date range Last year is applied. The report on your dashboard is automatically displayed using this timeframe. In the following example, the report would be limited to the last 12 months.

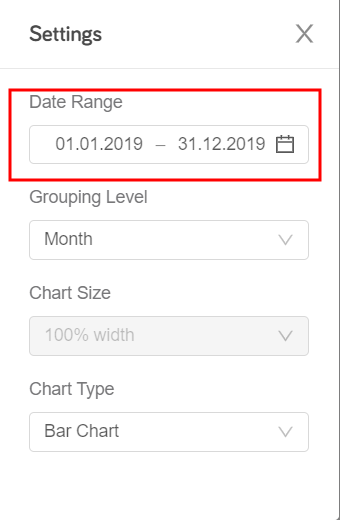
- Select a specific date range using the date picker under Date Range.
The report on your dashboard is automatically displayed using this timeframe. In the following example, the report would be limited to 2 months.

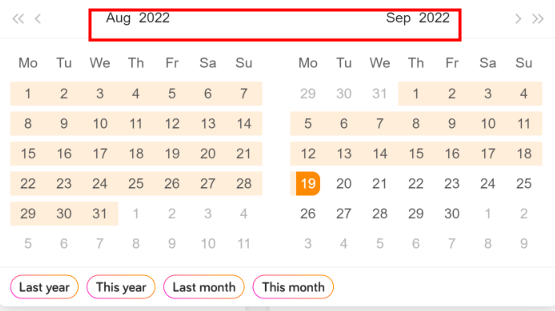
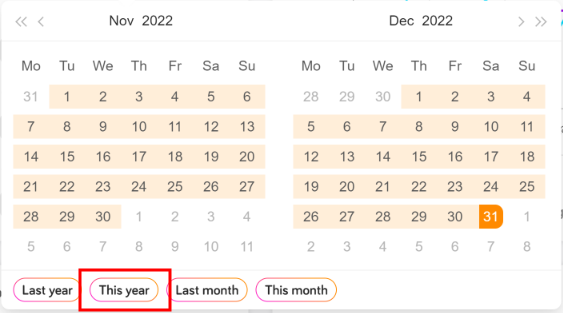
- Apply an absolute timeframe under Date Range. You can choose Last year, This year, Last month, or This month. In the following example, by selecting This year, the report in your dashboard is automatically refreshed using this timeframe and would be limited to the 12 months of the current year.

- If you do not select a specific timeframe under Date Range, the default date range Last year is applied. The report on your dashboard is automatically displayed using this timeframe. In the following example, the report would be limited to the last 12 months.
- When you have completed the configuration, close the Settings panel.
Configure a Full-Screen Report
- In the main menu, click Analytics > BI Bookmarks. The Reports dashboard opens.
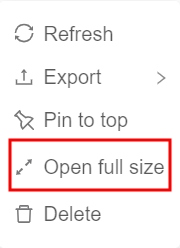
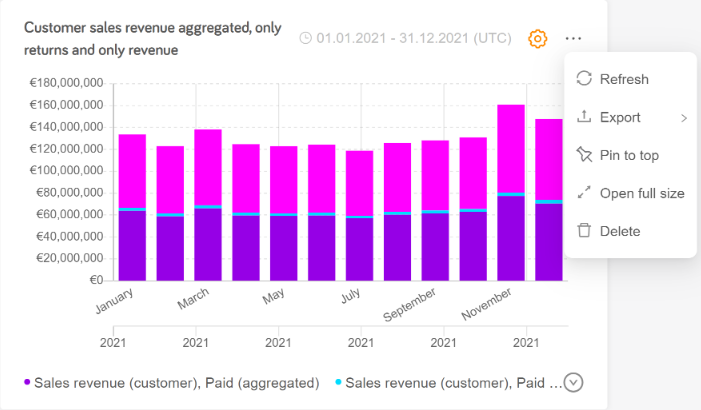
- Click the ... button on the upper-right side of the report that you want to view in full screen. The configuration panel opens.
- Click Open full size.
An expanded version of the report opens in a new tab.
- Click the ⚙ button on the upper-right side of the tab. The Settings panel opens.
- Configure the report using the following options:
- Set timeframe — Change the timeframe for which you want to display your data. For more information, see Set Date Range.

- Grouping Level — Change the level of data granularity in your report. You can display data per Hour, Day, Week, Month, or Quarter.
- Chart Type — Change the way in which your data is displayed. You can choose Line Chart, Pie Chart, Bar Chart, or Table.
- Set timeframe — Change the timeframe for which you want to display your data. For more information, see Set Date Range.
- When you have completed the configuration, close the Settings panel.


Manage the Reports on Your Dashboard
You can manage the reports on your Reports dashboard in the following ways:
- In the main menu, click Analytics > BI Bookmarks. The Reports dashboard opens.
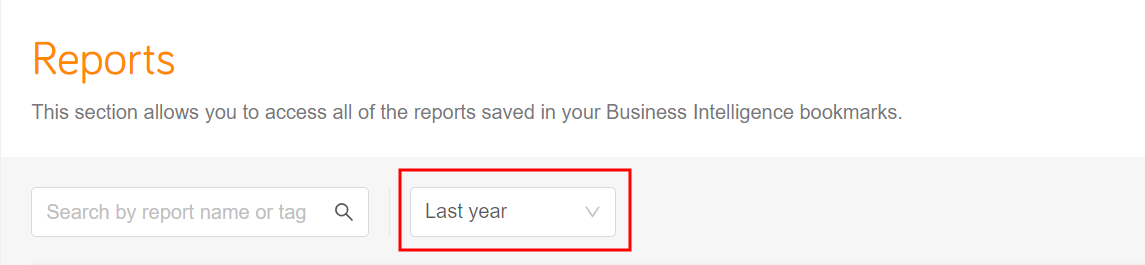
- Select different timeframe as necessary by clicking on dropdown.
On the upper-right side of the screen, the default timeframe Last year is applied. All the reports on your dashboard are automatically displayed using this timeframe.
All of the reports on your dashboard are automatically refreshed using this timeframe.
- Click the ... button on the upper-right side of the report that you want to pin to the top of your dashboard. The configuration panel opens.
- Click Pin to top.
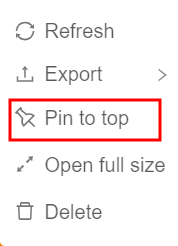

The report is now pinned to the top of your dashboard.
- Click the ... button on the upper-right side of the report that you want to delete. The configuration panel opens.
- Click Delete.
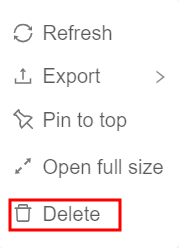

The report is deleted from your dashboard.
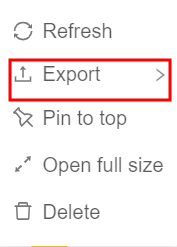
- Click the ... button on the upper-right side of the report that you want to refresh. The configuration panel opens.
- Click Refresh on the upper-right side of the report that you want to refresh.

The report has now been refreshed on your dashboard.
- Click the ... button on the upper-right side of the report that you want to expand. The configuration panel opens.
- Click Open full size.
An expanded version of the report is opened in a new tab. For more information, see Configure a Full-Screen Report.
- In the main menu, click Analytics > BI Bookmarks. Your Reports dashboard opens.
- Click the ... button on the upper-right side of the report that you want to export to an offline format. The configuration panel opens.
- Click Export. You can choose between PDF, MS Excel, or MS Word.
An exported version of the report downloads onto your computer or mobile device.
Manage Tags on Your Dashboard
You can manage the tags on your Reports dashboard in the following ways:
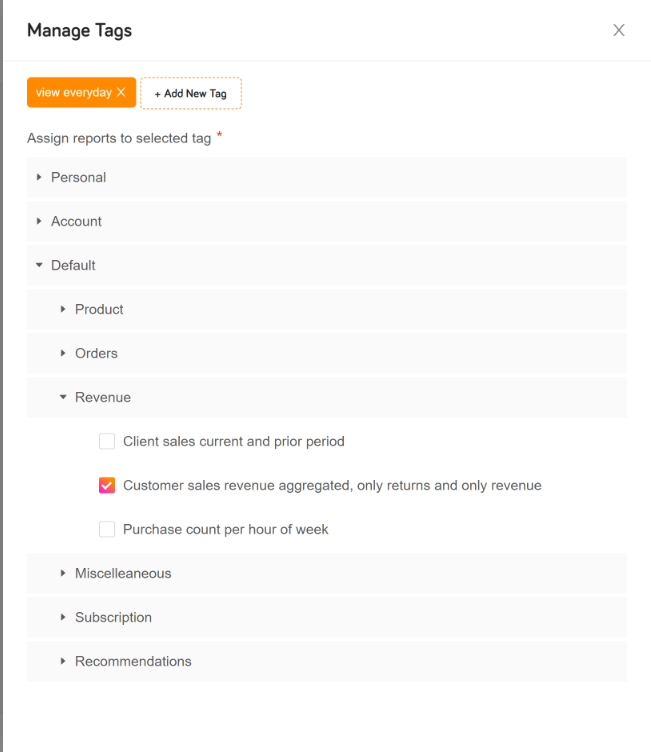
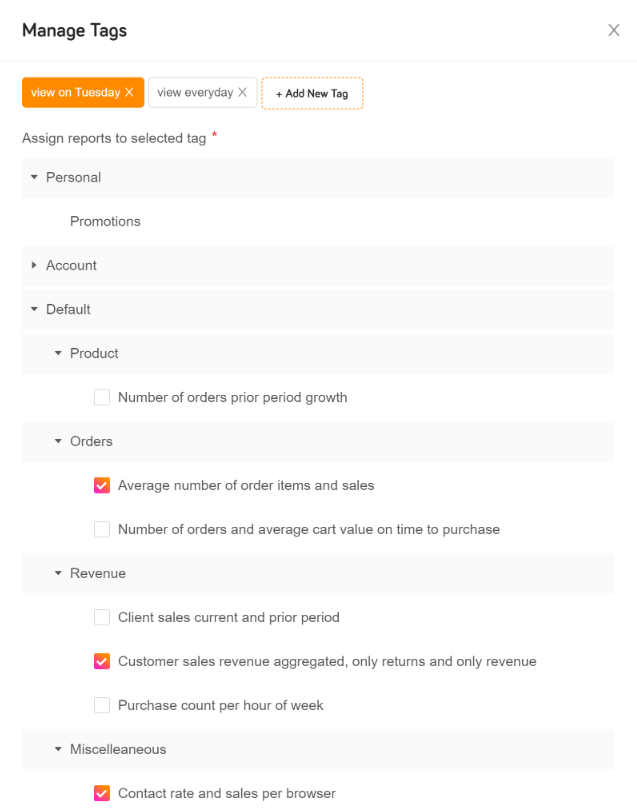
- On your Reports dashboard, click Manage Tags. A side window will appear where all of the available BI bookmarks are displayed.
- Type text in the Add New Tag field.
- Press Enter and select the reports you would like to add to the tag by using the checkboxes or selecting the folder containing the reports. Your tag will appear automatically at the top of the Dashboard.
- Create more tags as necessary.
- Close Manage Tags side window.
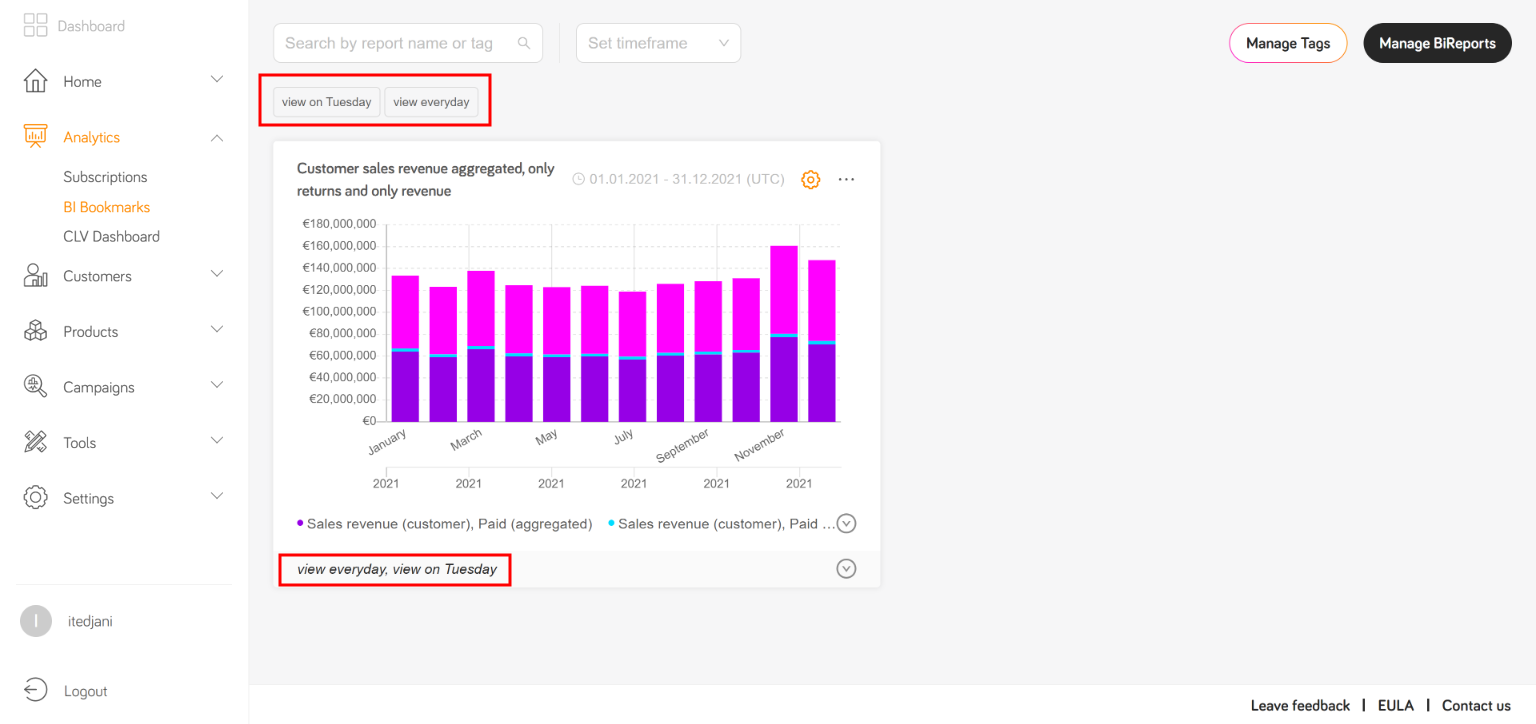
- Click the tag at the top of the Dashboard. Your dashboard now only includes reports that contain the tag.
The next time you open the Subscription Commerce Manager, this tag will be displayed.
Example
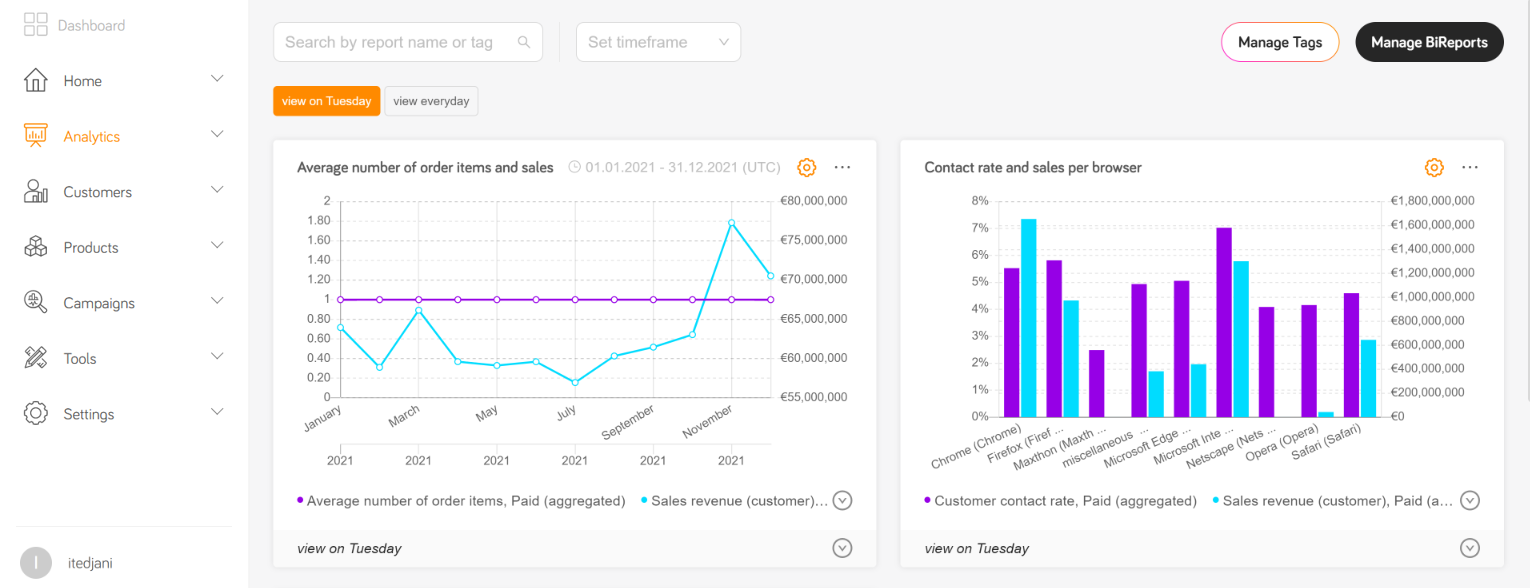
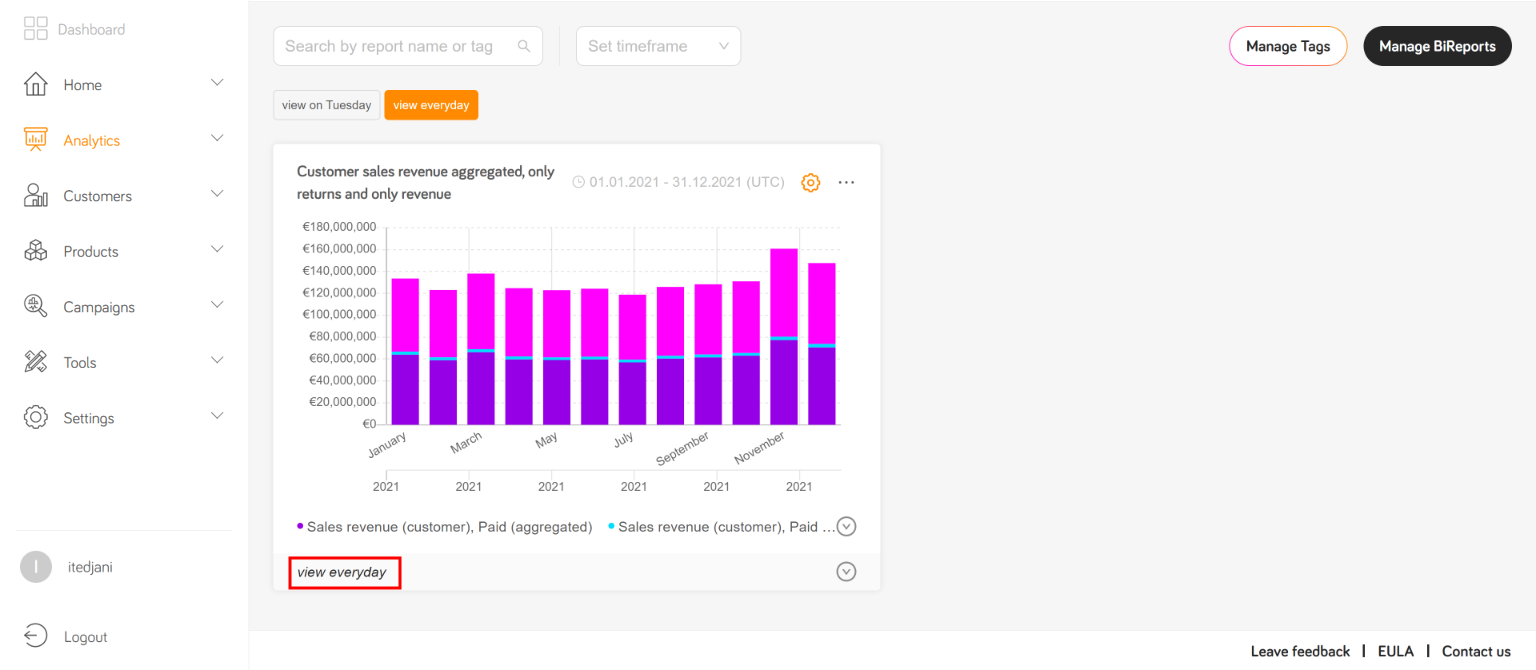
In this example, the user created two tags. One tag is for reports the user wants to view everyday.
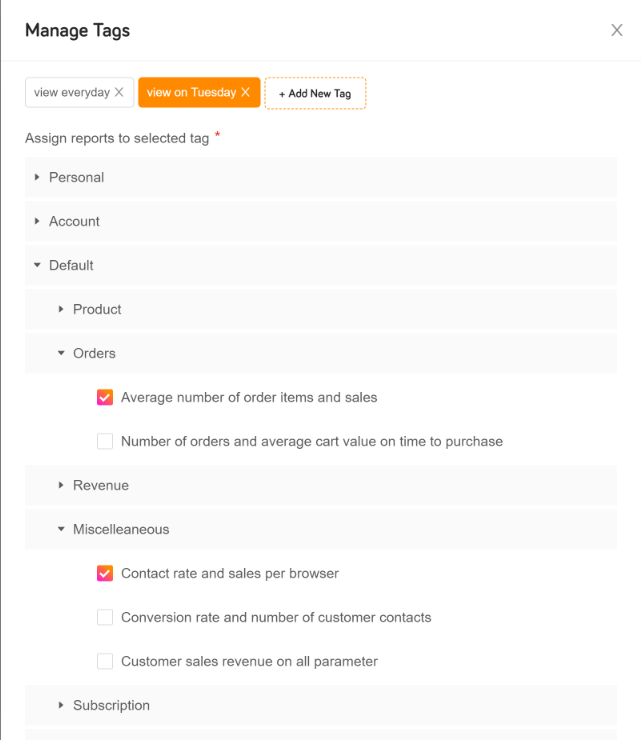
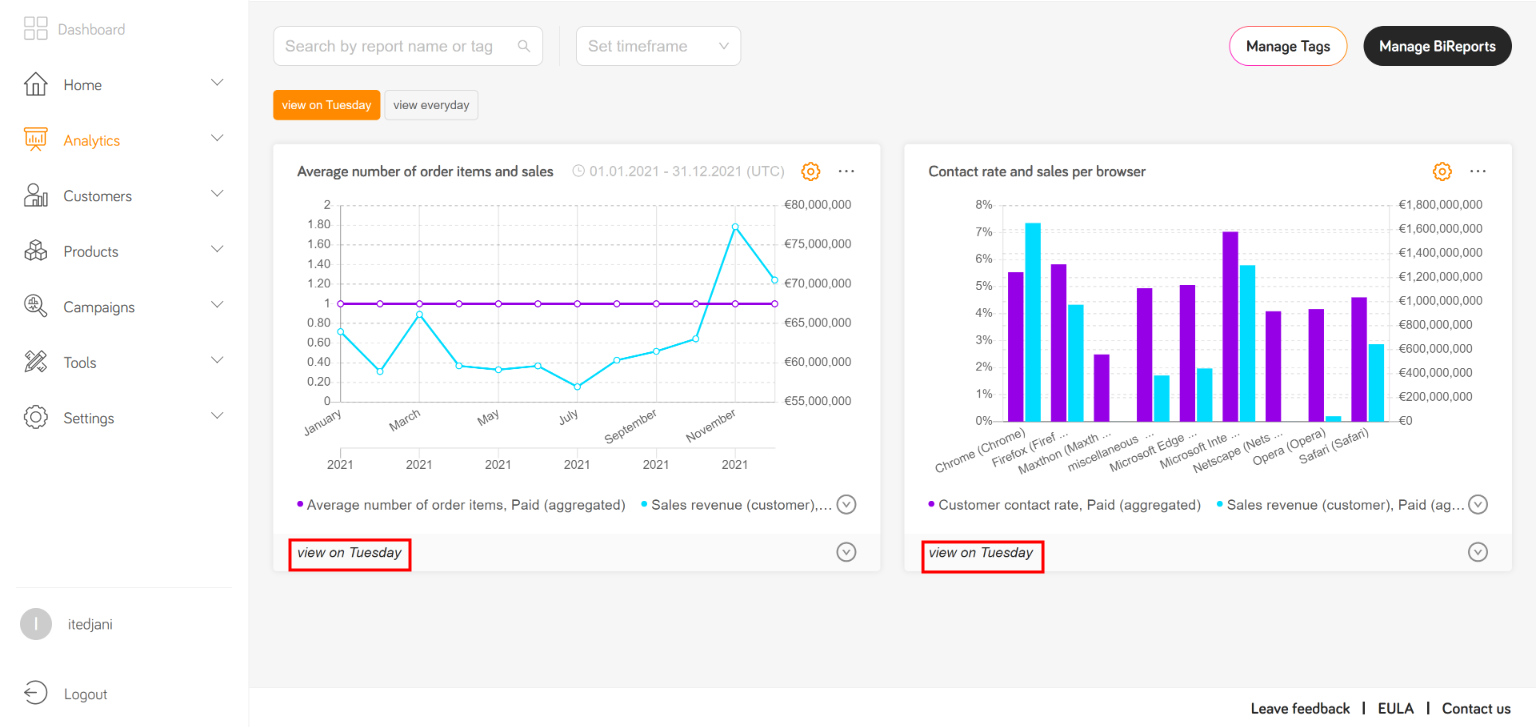
The second tag is for reports the user only wants to view on Tuesday.
The next time you open the Subscription Commerce Manager, these tags will be displayed at the top of the Dashboard.
- On your Reports dashboard, click Manage Tags. A side window will appear where all of the available BI bookmarks are displayed.
- Click the tag to which you would like to add reports.
- Add additional reports to more tags as necessary.
- Close Manage Tags side window.
- Click the tag at the top of the Dashboard. Your tag now includes the reports that you added.
Example
In this example, the user added reports to view on Tuesday tag.
The next time the user clicks the tag at the top of the Dashboard, all reports assigned to the tag will be displayed.
- On your Reports dashboard, click Manage Tags. A side window will appear where all of the available BI bookmarks are displayed.
- Click the x on the tag you would like to delete.
- Click OK.
- Close Manage Tags side window. The tag is now deleted at the top of the Dashboard.
Example
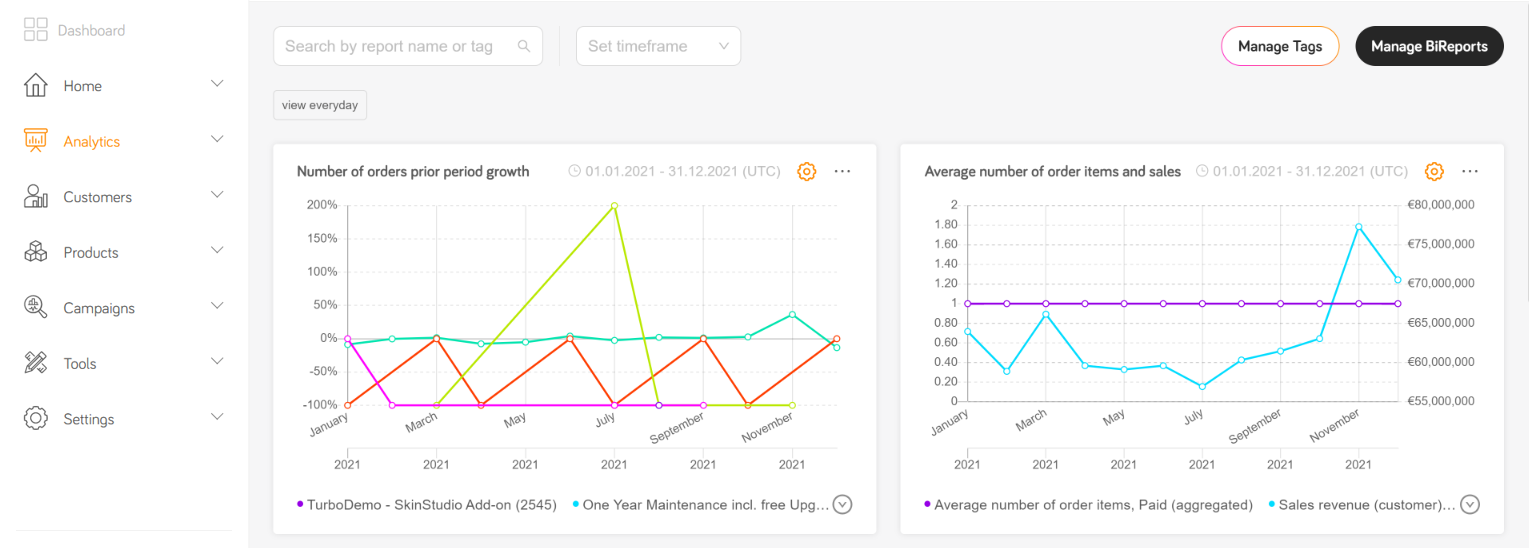
In this example, the user deleted view on Tuesday tag.
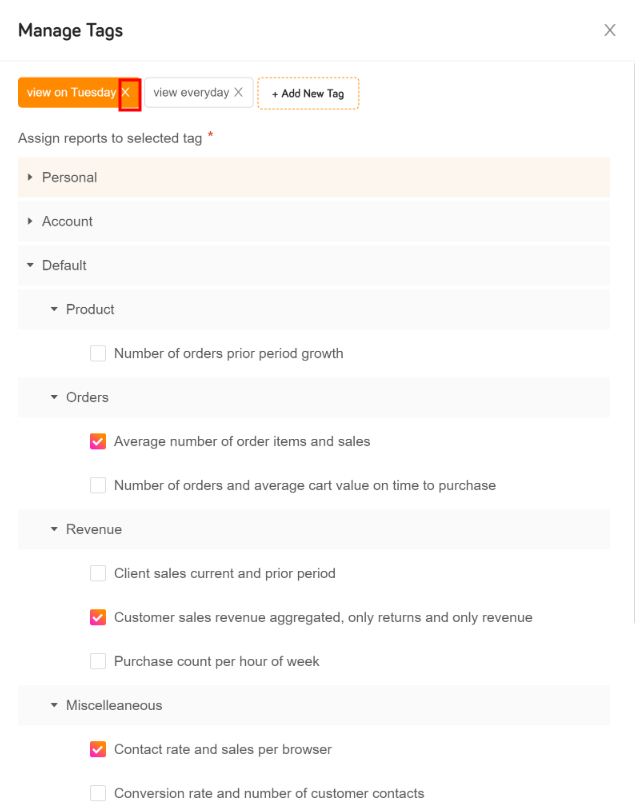
The tag is deleted at the top of the Dashboard. All reports assigned to the tag are no longer displayed.
Search for Reports on Your Dashboard
You can search the reports in your Subscription Commerce Manager Dashboard in the following ways:
- On your Reports dashboard, click Manage Reports. A side window appears where all of the available BI bookmarks are displayed.
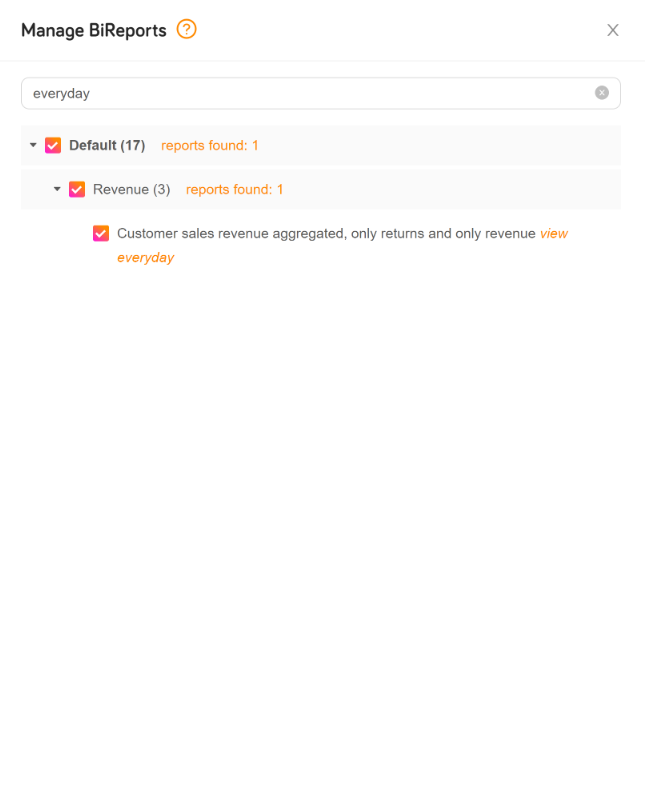
- In the search bar, type the name of the tag that you would like to find. All reports for the selected tag will appear.
- Select the reports you would like to add to your dashboard by using the checkboxes or selecting the folder containing the reports. Your tag will appear automatically under the search bar at the top of the Dashboard.
- Close the Manage Reports side window.
- Click the tag at the top of the Dashboard. Your dashboard now only includes reports assigned to the tag.
Example
In this example, the user searched for two tags. One tag is for reports the user wants to view everyday.
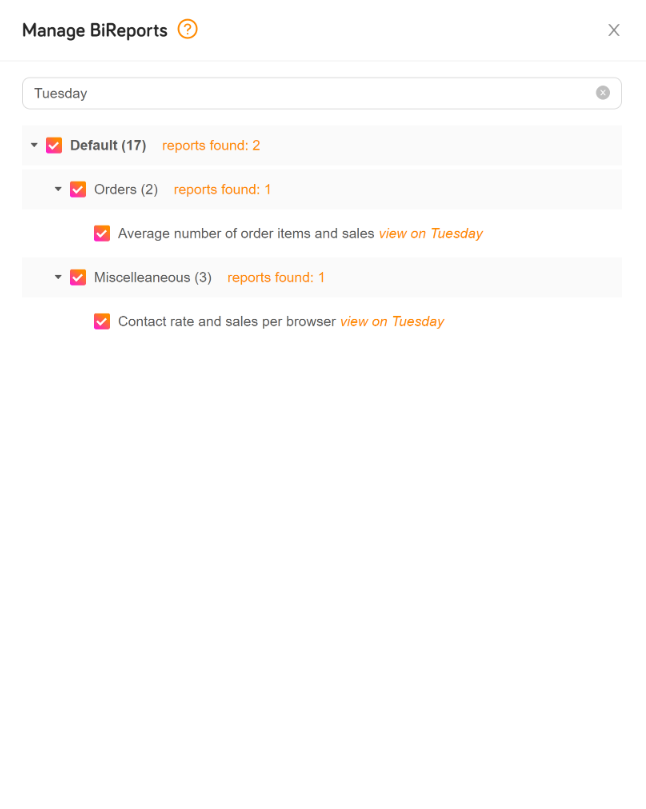
The second tag is for reports that the user only wants to view on Tuesday.
The user can then filter the dashboard by clicking one of the tags at the top of the Dashboard.
- On your Reports dashboard, click Manage Reports. A side window appears where all of the available BI bookmarks are displayed.
- In the search bar, type the keyword that you would like to use as a filter.
- All reports for the selected keyword will appear.
- Select the reports you would like to add to your dashboard by using the checkboxes or selecting the folder containing the reports.
- Close the Manage Reports side window. Your dashboard now only includes reports that contain your keyword.
Example
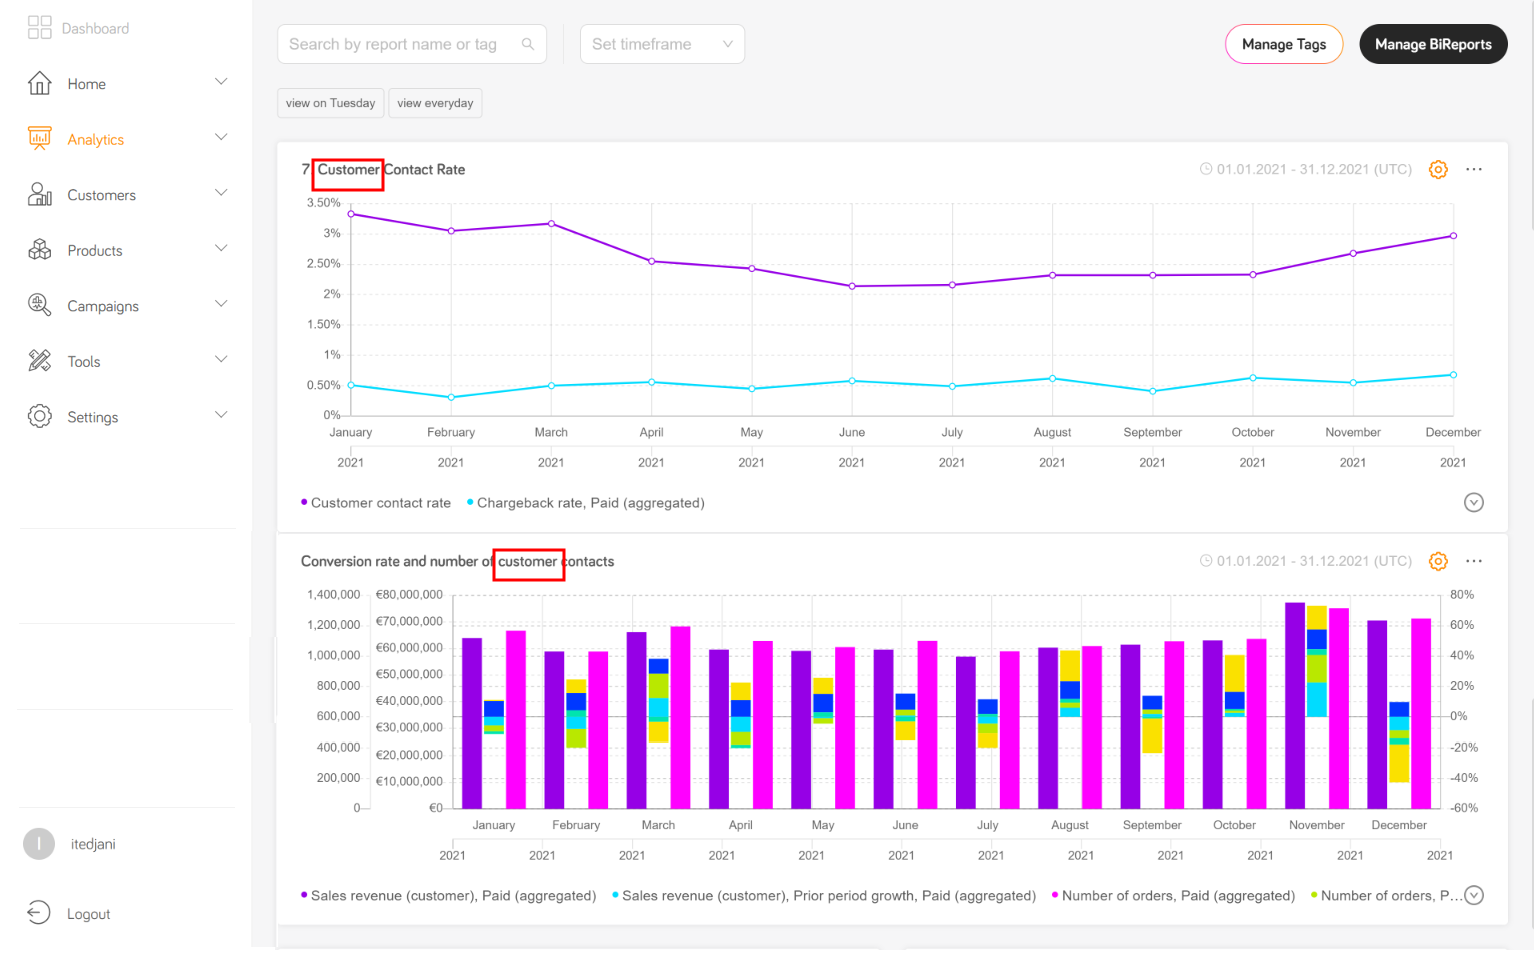
In this example, the user searched for the keyword customer![]() An individual or business purchasing your product or service by placing an order through Cleverbridge. The customer is the end user of this product, as they are not allowed to resell the purchased products or services.
A customer is unique per client. If a customer purchases products or services from two different clients, there are 2 separate records of said customer. and selected reports using the checkboxes.
An individual or business purchasing your product or service by placing an order through Cleverbridge. The customer is the end user of this product, as they are not allowed to resell the purchased products or services.
A customer is unique per client. If a customer purchases products or services from two different clients, there are 2 separate records of said customer. and selected reports using the checkboxes.
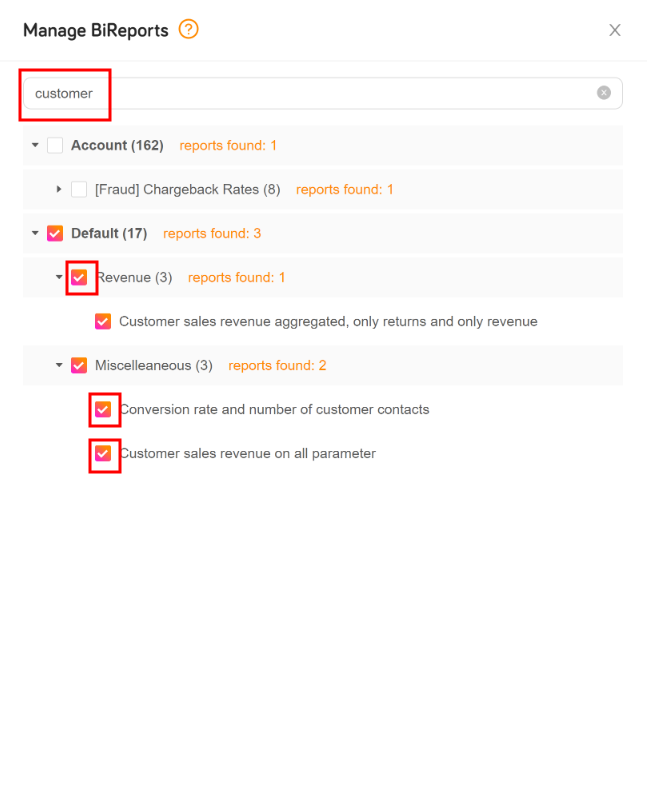
As a result, only selected reports that contain the keyword are displayed.