Performance Analytics
Performance Analytics is a self-service dashboard that allows you to monitor your e-commerce business performance with Cleverbridge, so you can make data-driven decisions on a timely basis. It consolidates and visualizes the most important metrics to track your business performance. To access analytics regarding performance, go to the main menu of our web admin tool and click Analytics > Performance.
Important
You can access the performance analytics and subscription analytics embedded into our web admin tool once you complete the onboarding process successfully. For more information, contact Client Experience.
Tip
Like the Business Intelligence (BI) tool, Performance Analytics and Subscription Analytics provide data to be used as a reference and not for accounting purposes. If you want to generate reports for accounting purposes, use the clearing reports available in the Commerce Assistant. For more information, see Important Information about Business Intelligence Reporting.
Check out the video below to learn how you can use performance analytics to track your e-commerce business's performance.
Key Terms
| Key Terms | Description |
|---|---|
| Net Revenue |
Amount of revenue generated by subscribers based on the exchange rate at the time of the transaction. All discounts and shipping costs are subtracted from the net revenue, while Cleverbridge fees and affiliate |
| Orders |
Number of paid orders in a given period. Free registrations and quotes are not included in this count. Fully refunded items reduce this count. |
| AOV |
Average value of all items in the shopping cart for any given order |
| Conversion Rate |
Number of initial orders divided by the total number of sessions at the checkout. The conversion rate may be more than 100% if the majority of orders were completed without passing through the checkout process. |
| Refund Rate |
Percentage of all transactions that were fully or partially refunded during a given period. |
| CC Chargeback |
Sum of Visa and Mastercard chargebacks processed in the current month divided by the sum of all paid transactions processed by Visa in the current month and all paid transactions processed by Mastercard during the previous month. NoteThe credit card chargeback rate is applicable to purchases paid with Visa and Mastercard. Chargeback rates with Visa and Mastercard are calculated differently:
|
Performance Analytics Pages
Performance Analytics offers the following pages to help you analyze your business:
The Summary is an at-a-glance view of the most important KPIs of your business in the selected month.
On the following screenshot, the menu items in the left-hand side navigation bar coincide with the respective tile, which means that each tile you click leads you to the corresponding report in the navigation bar.
By clicking on ![]() in the top right corner you will see a list of filters you can apply to the report. For descriptions, see Filters.
in the top right corner you will see a list of filters you can apply to the report. For descriptions, see Filters.

Net Revenue displays the net revenue that subscribers paid to Cleverbridge (based on the exchange rate at the time of transaction). This calculation subtracts any discounts or shipping costs. Cleverbridge fees and affiliate commissions are included.
The Net Revenue chart shows the following data:
- Net Revenue: selected period
- LY Net Revenue: Net Revenue last year in the same period
The Net Revenue (€) by chart shows the following data:
- Net Revenue: selected period
- LY Net Revenue: Net Revenue last year in the same period

Orders Number of paid orders in the selected period. Free registrations and quotes are not included in this count. Fully refunded items reduce this count.
The Orders and Order By chart display the following data:
- Orders: in the selected period
- LY Orders: last year in the same period

The AOV page displays the graphs about average order value (AOV), which is average value of orders. In Performance Analytics, AOV is calculated as the net revenue divided by the number of orders.
The AOV and AOV bycharts display the following data:
- AOV: average order value in the selected period
- LY AOV: average order value last year in the same period

Conversion Rate is the number of initial orders divided by the total number of sessions at the checkout. The conversion rate may be more than 100% if the majority of orders were completed without passing through the checkout process.
The Conversion Rate and Conversion Rate by charts display the following data:
- Conversion Rate: selected period
- LY Conversion Rate: Conversion Rate last year in the same period

Refund Rate displays the percentage of transactions that were fully or partially refunded during the selected period.
The Refund Rate and Refund Rate by charts display the following data:
- Refund Rate: selected period
- LY Refund Rate: Refund Rate last year in the same period

Chargeback Rate displays sum of Visa and Mastercard chargebacks processed in the current month divided by the sum of all paid transactions processed by Visa in the current month and all paid transactions processed by Mastercard during the previous month.
The Chargeback Rate and Chargeback Rate by charts display the following data:
- Chargeback Rate: selected period
- LY Chargeback Rate: Chargeback Rate last year in the same period

X-Parameter![]() The x-parameter is a variable appended to a URL that allows grouping and tracking orders for later reporting purposes. It also enables you to pass through data that you want to capture in the order process. X-parameters can also be used to control design elements based on the value of the x-parameter. displays origin of your revenue, subscription movements, and renewal rate as per up to 5 custom x-parameter classes and up to 10 hierarchical x-parameter levels. For more information on x-parameters, see Set Up X-Parameters. X-parameters are variables appended to the order processing URLs that let you:
The x-parameter is a variable appended to a URL that allows grouping and tracking orders for later reporting purposes. It also enables you to pass through data that you want to capture in the order process. X-parameters can also be used to control design elements based on the value of the x-parameter. displays origin of your revenue, subscription movements, and renewal rate as per up to 5 custom x-parameter classes and up to 10 hierarchical x-parameter levels. For more information on x-parameters, see Set Up X-Parameters. X-parameters are variables appended to the order processing URLs that let you:
- Pass data you want to capture in the order processing, such as sources of revenue, customer
 An individual or business purchasing your product or service by placing an order through Cleverbridge. The customer is the end user of this product, as they are not allowed to resell the purchased products or services.
A customer is unique per client. If a customer purchases products or services from two different clients, there are 2 separate records of said customer. information, and affiliate and partner A company that buys your products in bulk for a discounted price and resells them to their customers for a profit. In legal terms, a partner is a regular customer as there is no partnership agreement with Cleverbridge in place. information
An individual or business purchasing your product or service by placing an order through Cleverbridge. The customer is the end user of this product, as they are not allowed to resell the purchased products or services.
A customer is unique per client. If a customer purchases products or services from two different clients, there are 2 separate records of said customer. information, and affiliate and partner A company that buys your products in bulk for a discounted price and resells them to their customers for a profit. In legal terms, a partner is a regular customer as there is no partnership agreement with Cleverbridge in place. information
- Group and track orders for reporting
The various metrics on the X-Parameters bar chart help you measure how successful your different promotional activities are. For more information on how x-parameters are used to pass information through the checkout process to track revenue, see Provide Incentives for Purchase, X-Parameter and Revenue Tracking Reporting, and Set Up Revenue Tracking.
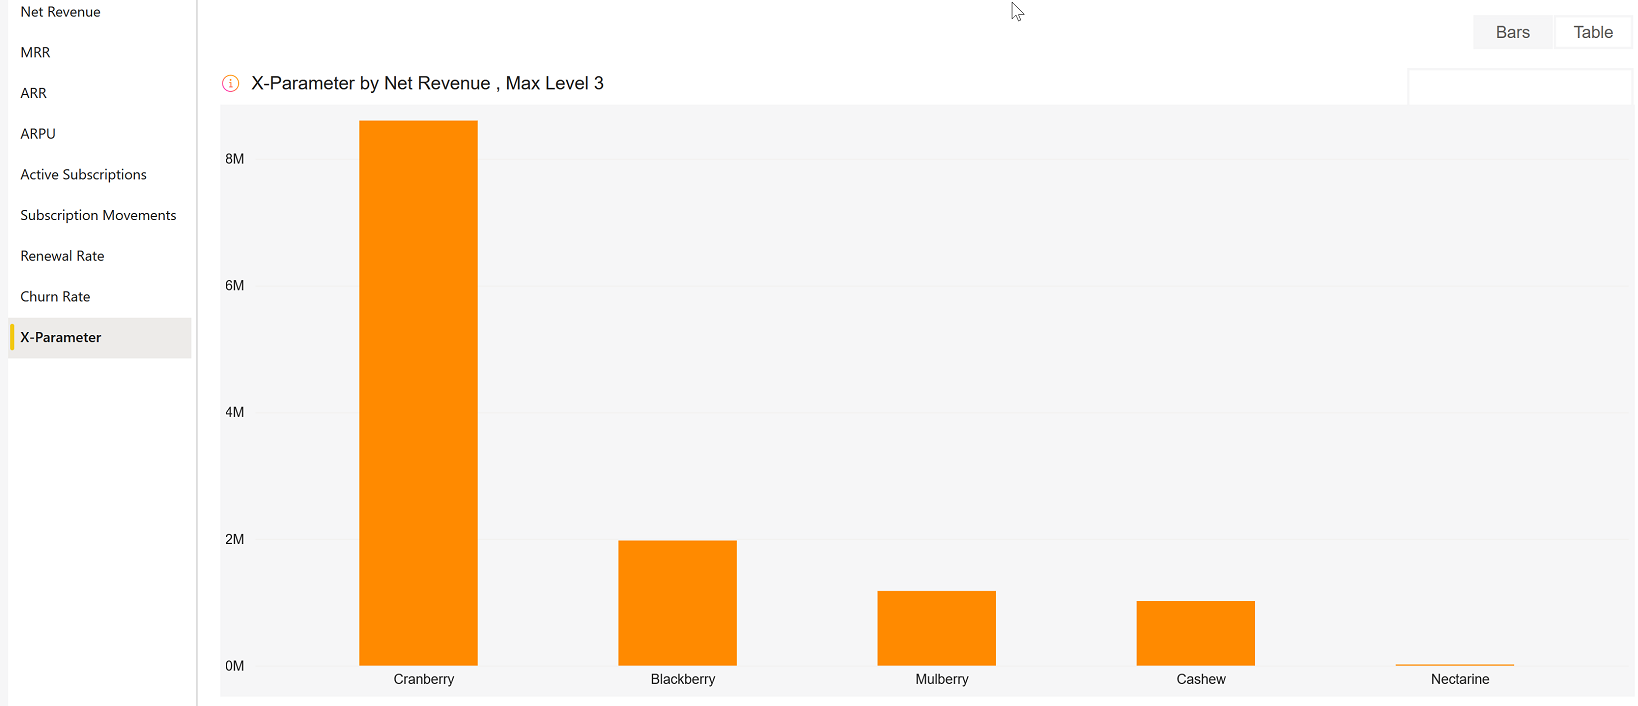
The X-parameters bar chart displays the following metrics for the 5 custom x-parameter classes, which you can drill down to see 9 further x-parameter sub levels:
- Net Revenue
- New Subscriptions
- Renewed Subscriptions
- Churned Subscriptions
- Renewal Rate
The Table tab displays the entire data used to calculate the metrics of the x-parameter bar charts including the x-parameter classes and their sub levels. You can also view the x-parameter table to see the parameter classes and their sub levels.
Important
To use x-parameters metrics and x-parameter filters, first you need to create the x-parameter categories and subcategories in the system. Only then the data gets populated in the x-parameter page and the x-parameter filters.
Filters
The drop-down elements on the right-hand side allow you to filter for a particular result. The applied filters are visible above the charts and can be cleared with the X sign.

The filters are available for each page of performance analytics and let you filter data by:
- Date Range: month-day-year
- Client: Cleverbridge client name/ID
- Currency: USD, EUR, or GBP
- Product: name/ID of the product
- Recurrence: recurring or non recurring sales
- Renewal Period: monthly, yearly, or other subscription running periods
- Interval: subscription item A subscription item is component of a subscription with its own set of attributes including price, description and feature set. interval number
- Payment Exchange of money for goods and services in an acceptable amount to the customer where the payment amount has been agreed upon in advance. The customer can only pay with an accepted payment method. Each payment has an individual payment cost. Type: payment type Consolidates multiple payment methods into groups by the type of payment the customer uses, for example, Credit Card as a payment type that encompasses Visa Credit Card, Master Card Credit, Amex, in short: all credit cards. used by a customer
- Payment Subtype: payment subtype used by a customer
- Region: world region as defined by Cleverbridge
- Australia
- China
- Hong Kong
- India
- Indonesia
- Japan
- Malaysia
- New Zealand
- Philippines
- Republic of Korea
- Singapore
- Taiwan
- Thailand
- Vietnam
- Albania
- Austria
- Belarus
- Belgium
- Bosnia and Herzegovina
- Bulgaria
- Canary Islands
- Croatia
- Cyprus
- Czech Republic
- Denmark
- Estonia
- Finland
- France
- Germany
- Greece
- Hungary
- Iceland
- Ireland
- Italy
- Latvia
- Liechtenstein
- Lithuania
- Luxembourg
- Macedonia
- Malta
- Monaco
- Montenegro
- Netherlands
- Norway
- Poland
- Portugal
- Republic of Moldova
- Romania
- Russian Federation
- San Marino
- Serbia
- Slovakia
- Slovenia
- Spain
- Sweden
- Switzerland
- Ukraine
- United Kingdom
- Argentina
- Bolivia
- Brazil
- Chile
- Colombia
- Costa Rica
- Ecuador
- El Salvador
- Guatemala
- Honduras
- Mexico
- Nicaragua
- Panama
- Paraguay
- Peru
- Puerto Rico
- Uruguay
- Venezuela
- Canada
- United States
- Country: billing country
- Business Category: B2C or B2B
- MVT Multivariate testing (MVT) is a technique for testing two or more different variables in the checkout process to determine which variable creates more revenue or a higher conversion rate.: Multi-variate testing campaign name/ID
- Partner: other businesses that buy your products in a B2B model. Partners purchase your products at a discount and then sell them to customers. Partners communicate directly with customers.
- X-Parameter Class: up to 5 x-parameter classes per client with customized names
- X-Parameter: name/ID of x-parameter
| Cleverbridge Region | Countries |
|---|---|
| APAC |
|
| EUROPE |
|
| LATAM |
|
| NOAM |
|
| ROW | All others |