Subscriptions
Subscriptions is a dashboard that consolidates and visualizes the most important metrics to track your subscription business. To access subscription analytics, go to the main menu of our web admin tool and click Analyze > Subscriptions.
For a glossary of all subscription-specific terminology, see Subscription Glossary.
Important
You can access the subscription analytics embedded into our web admin tool once you complete the onboarding process successfully. For more information, contact Client Experience.
Tip
Like the Business Intelligence (BI) tool, the Subscriptions dashboard provides data to be used as a reference and not for accounting purposes. If you want to generate reports for accounting purposes, use the clearing reports available in Commerce Assistant (CA). For more information, see Important Information about BI Reporting.
Subscriptions Metrics
The Subscriptions dashboard offers five groups of metrics to help you analyze your subscription business:
1. Revenue
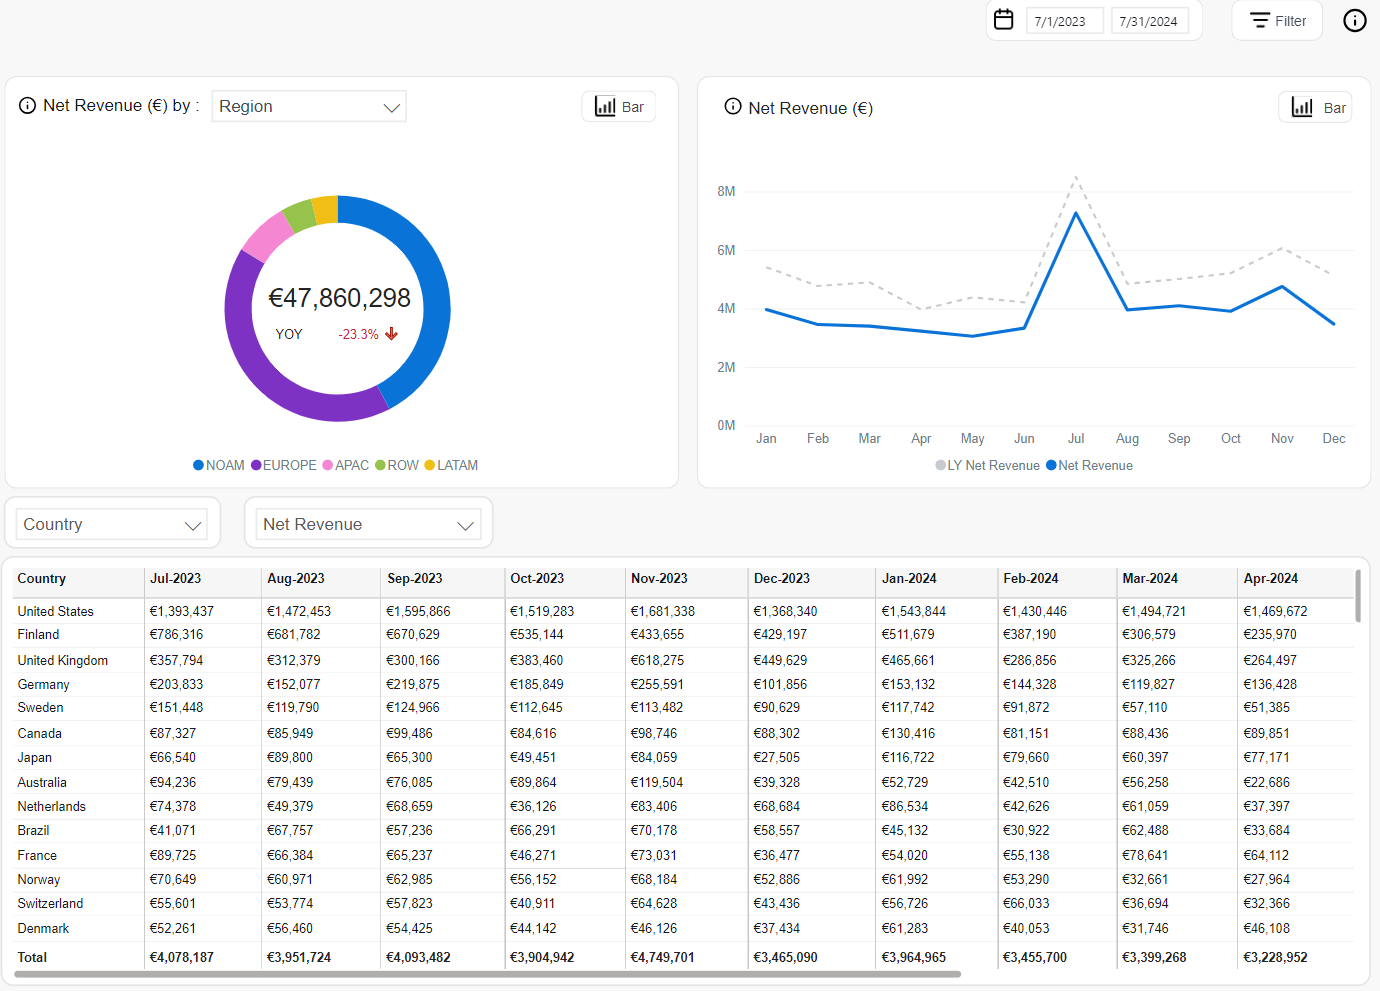
Net Revenue shows the net revenue that subscribers paid to Cleverbridge (based on the exchange rate at the time of transaction). This calculation subtracts any discounts or shipping costs. Cleverbridge fees and affiliate![]() An individual or a company that markets a product to potential customers. The Affiliate receives a commission on a specific action (also called event: e.g., sale, lead, click, visit etc.) previously agreed upon with you, the advertiser. Each action is tracked via a unique tracking link from Partnerize.
An affiliate is also called a publisher. commissions are included.
An individual or a company that markets a product to potential customers. The Affiliate receives a commission on a specific action (also called event: e.g., sale, lead, click, visit etc.) previously agreed upon with you, the advertiser. Each action is tracked via a unique tracking link from Partnerize.
An affiliate is also called a publisher. commissions are included.
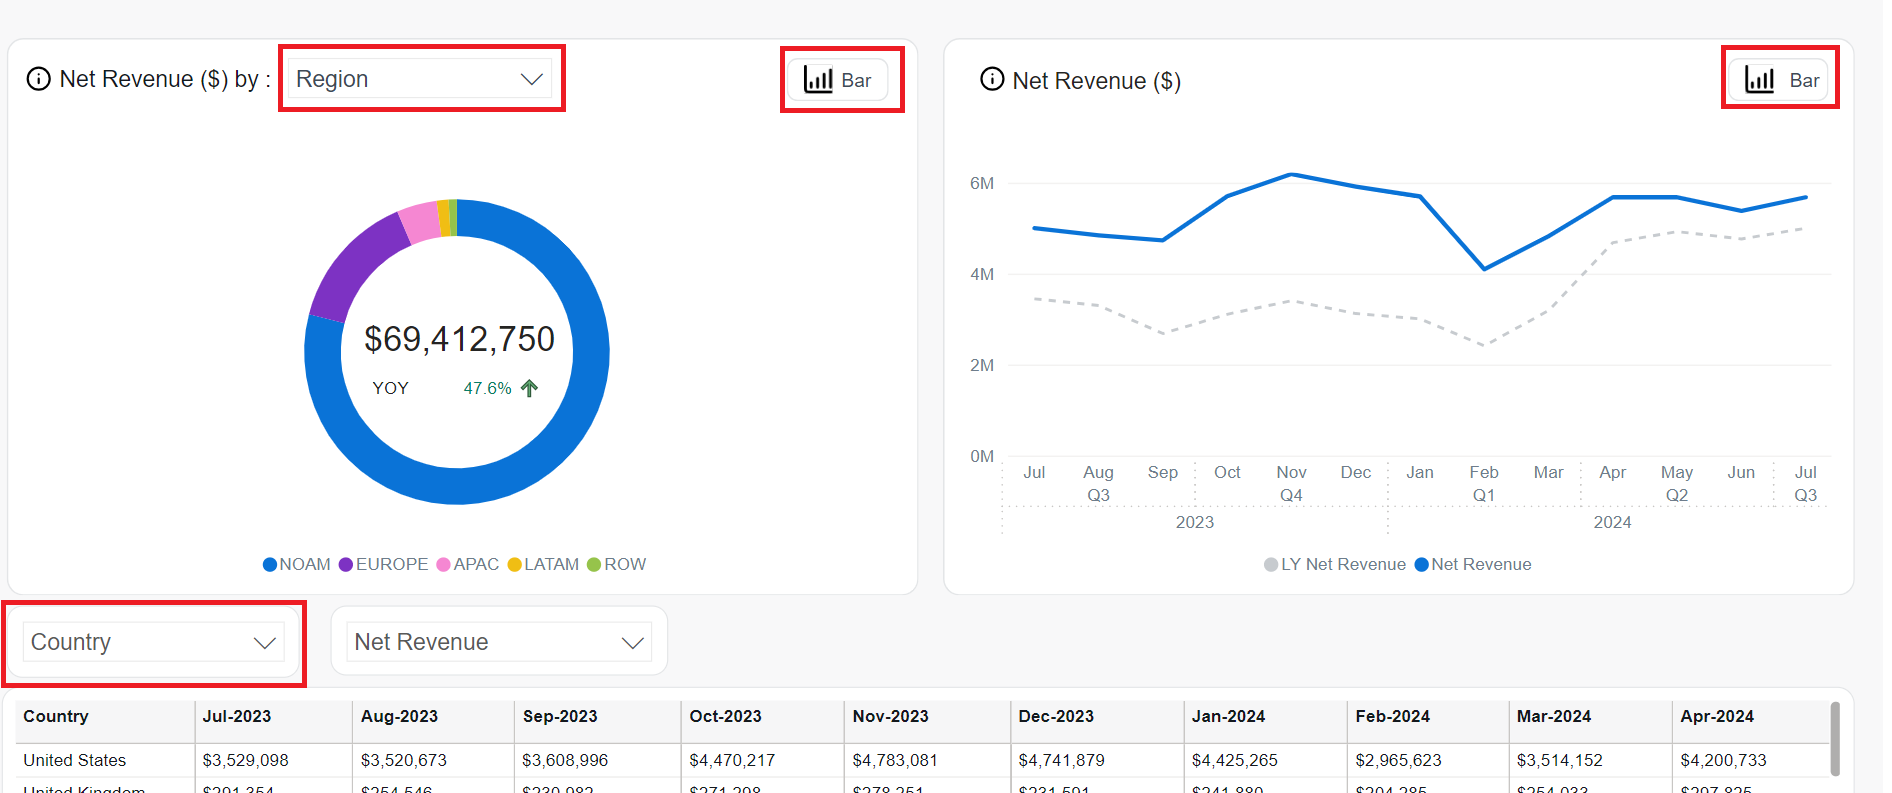
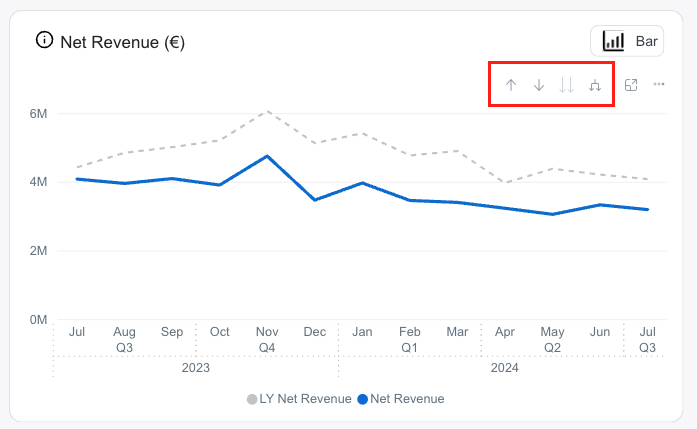
The Net Revenue chart shows the net revenue filtered by one of the available dimensions, for example, region or business category.
The Net Revenue chart shows the following data:
- Net Revenue: Net revenue during the selected period
- LY Net Revenue: Net Revenue last year in the same period
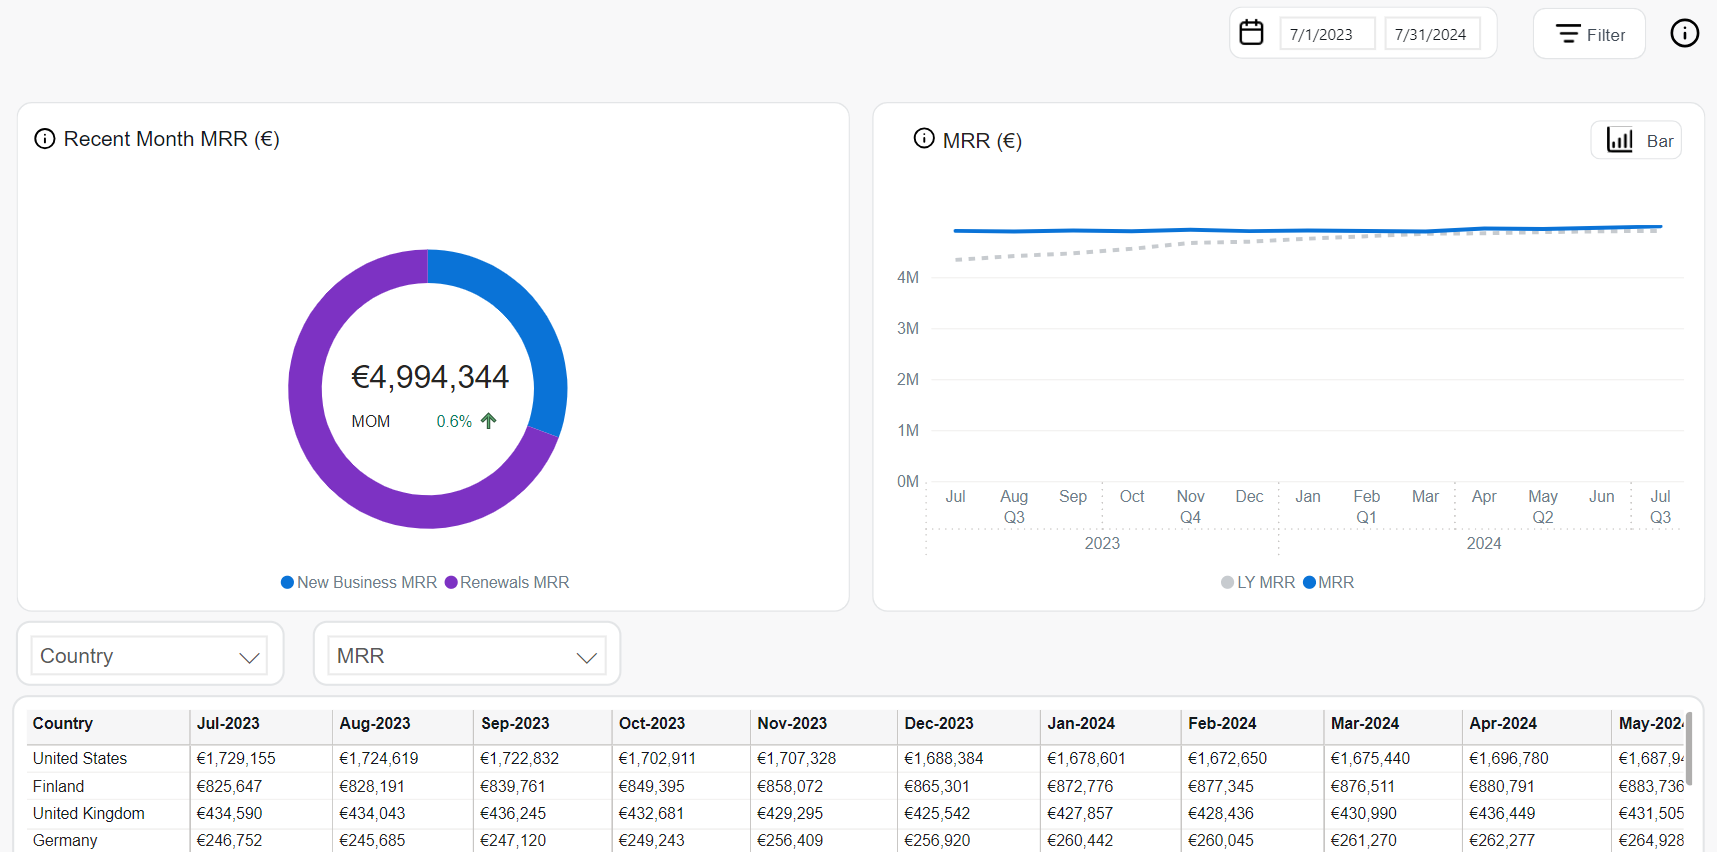
Total MRR shows your recurring revenue normalized into a monthly amount. MRR is important for analyzing business growth on a short-term basis, as a lot of subscriptions may have an annual renewal policy and seasonal dependencies, and a skewed distribution can significantly impact the analysis of dynamics in a shorter period.
The Recent Month MRR chart shows the share of MRR generated by new and renewed subscriptions.
- New Business MRR: MRR generated by new subscription items in a recent month
- Renewals MRR : MRR generated by renewed subscription items in a recent month
The MRR chart shows the following data:
- Total MRR: Total MRR of the selected period
- LY Total MRR: MRR last year in the same period
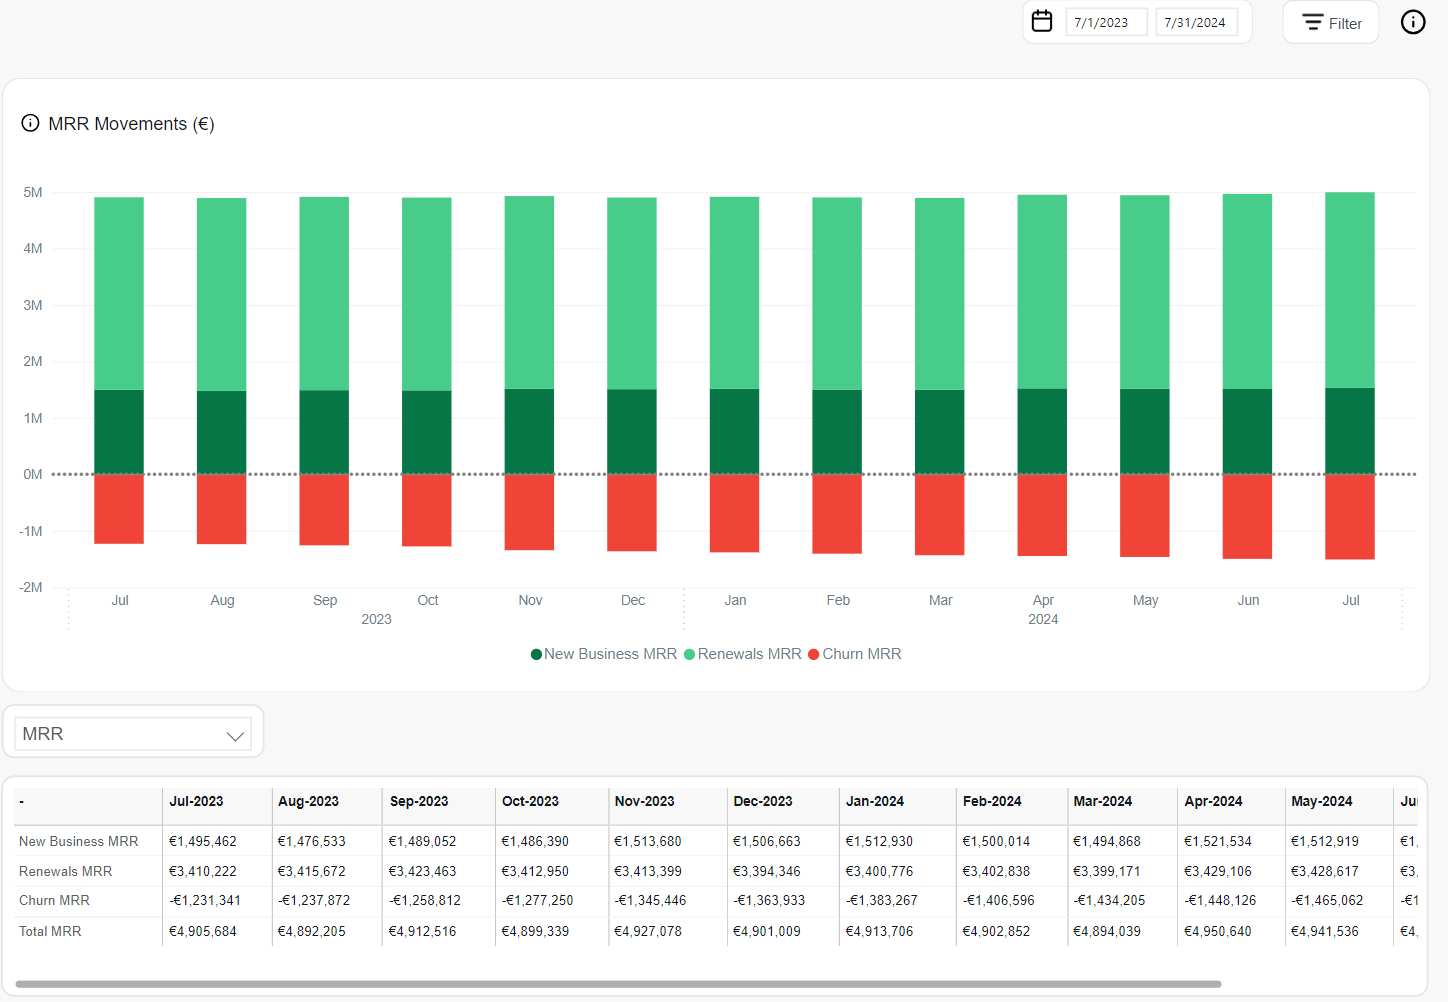
MRR Movements shows the share of MRR generated by new, renewed, and churned subscription items in a period.
- New Business MRR: MRR generated by new subscription items in a period
- Renewals MRR : MRR generated by renewed subscription items in a period
- Churn MRR: MRR generated by churned subscription items in a period
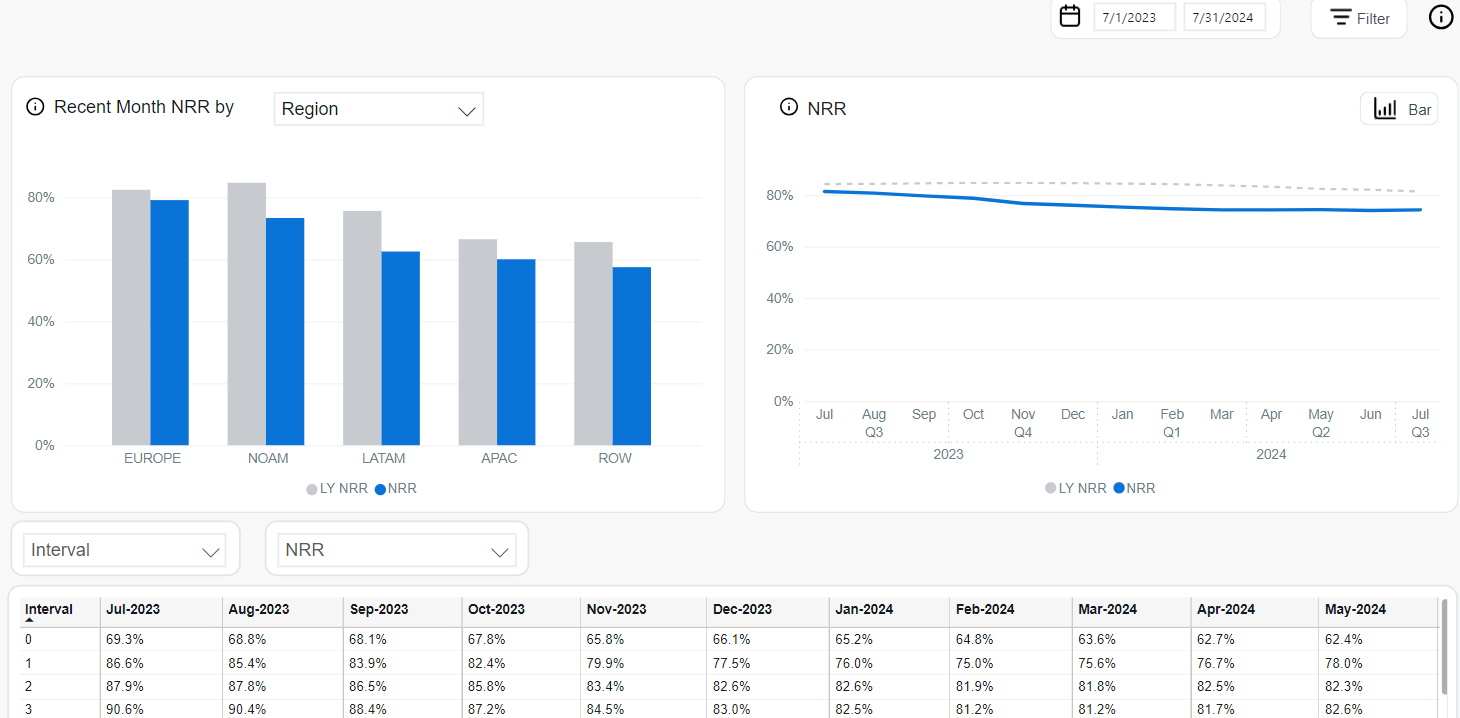
Net Revenue Retention (NRR) shows cumulative revenue growth or decline from existing customers, reflecting changes in MRR due to expansion, contraction, and churn over a given period. NRR is a key indicator of the health of your subscription-based business.
The NRR is calculated using the following formula: [(Starting MRR + Expansion MRR – Contraction MRR – Churn MRR) / Starting MRR] * 100%..
For definitions of different MRR types, see Subscription Glossary.
The Recent Month NRR chart shows the NRR from the current month filtered by one of the available dimensions, for example, region or payment type![]() Consolidates multiple payment methods into groups by the type of payment the customer uses, for example, Credit Card as a payment type that encompasses Visa Credit Card, Master Card Credit, Amex, in short: all credit cards..
Consolidates multiple payment methods into groups by the type of payment the customer uses, for example, Credit Card as a payment type that encompasses Visa Credit Card, Master Card Credit, Amex, in short: all credit cards..
The NRR chart shows the following data:
- NRR: Total NRR of the selected period
- LY NRR: NRR last year in the same period
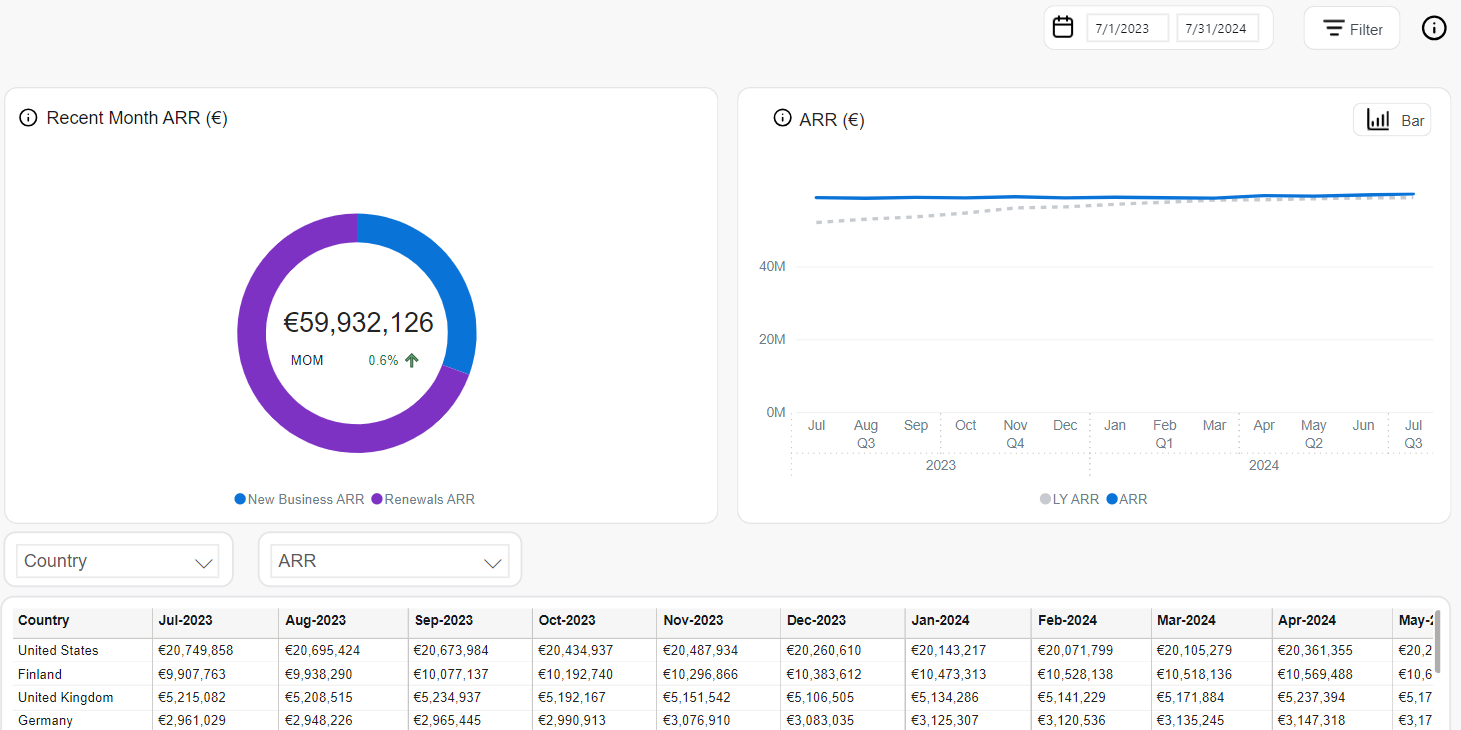
Annual Recurring Revenue (ARR) is a yearly representation of MRR. ARR helps project future revenue for the year based on your current monthly revenue.
The Recent Month ARR chart shows the ARR from the current month.
- New Business ARR: ARR generated by new subscription items in a recent month
- Renewals ARR: ARR generated by renewed subscription items in a recent month
ARR chart shows the following data:
- ARR: Total ARR of the selected period
- LY ARR: ARR last year in the same period
2. Performance
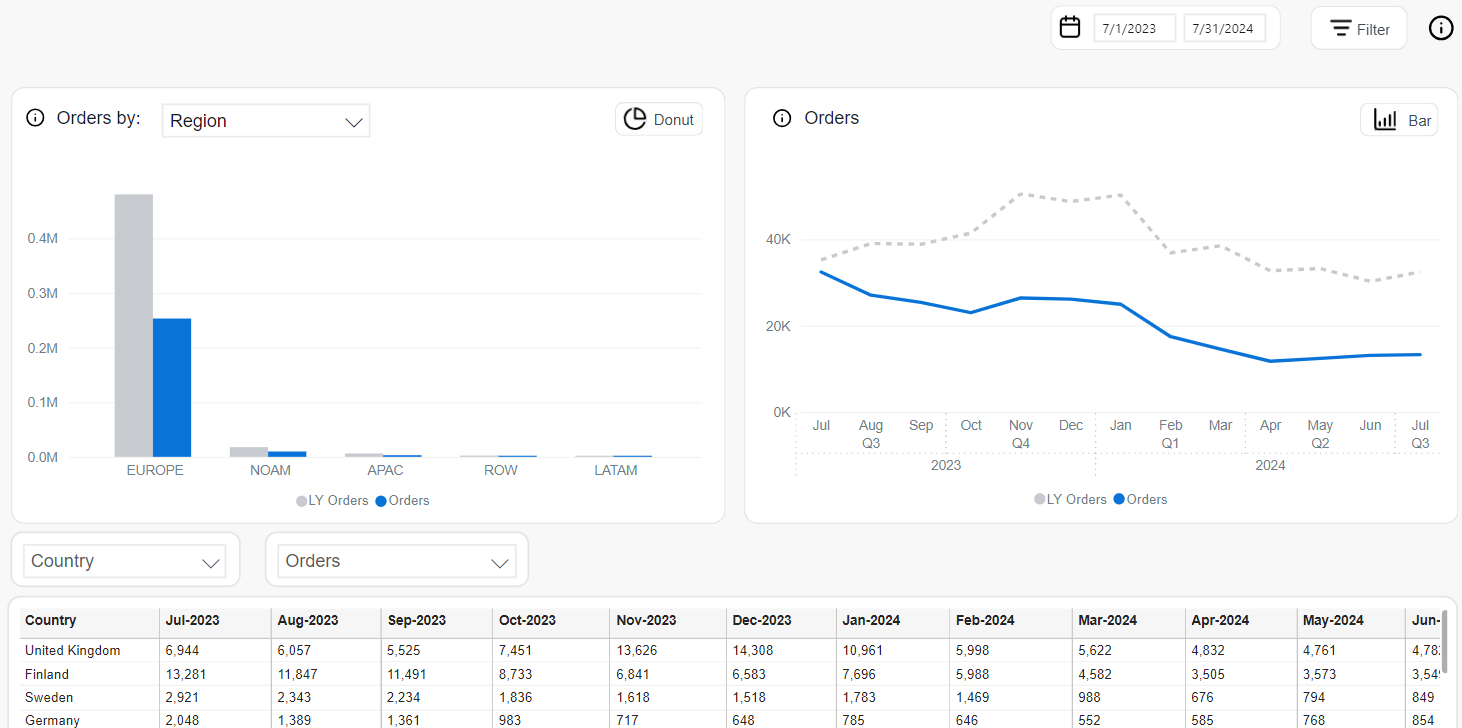
Orders represents the number of paid purchases, including free registrations, within the selected period. The count excludes detected fraudulent transactions, chargebacks, and fully refunded orders, whether refunded all at once or item by item over time.
The Orders bar chart displays the orders filtered by one of the available dimensions, for example, region or payment![]() Exchange of money for goods and services in an acceptable amount to the customer where the payment amount has been agreed upon in advance. The customer can only pay with an accepted payment method. Each payment has an individual payment cost. type.
Exchange of money for goods and services in an acceptable amount to the customer where the payment amount has been agreed upon in advance. The customer can only pay with an accepted payment method. Each payment has an individual payment cost. type.
The Orders line chart display the following data:
- Orders: Number of orders in the selected period
- LY Orders: Number of orders last year in the same period
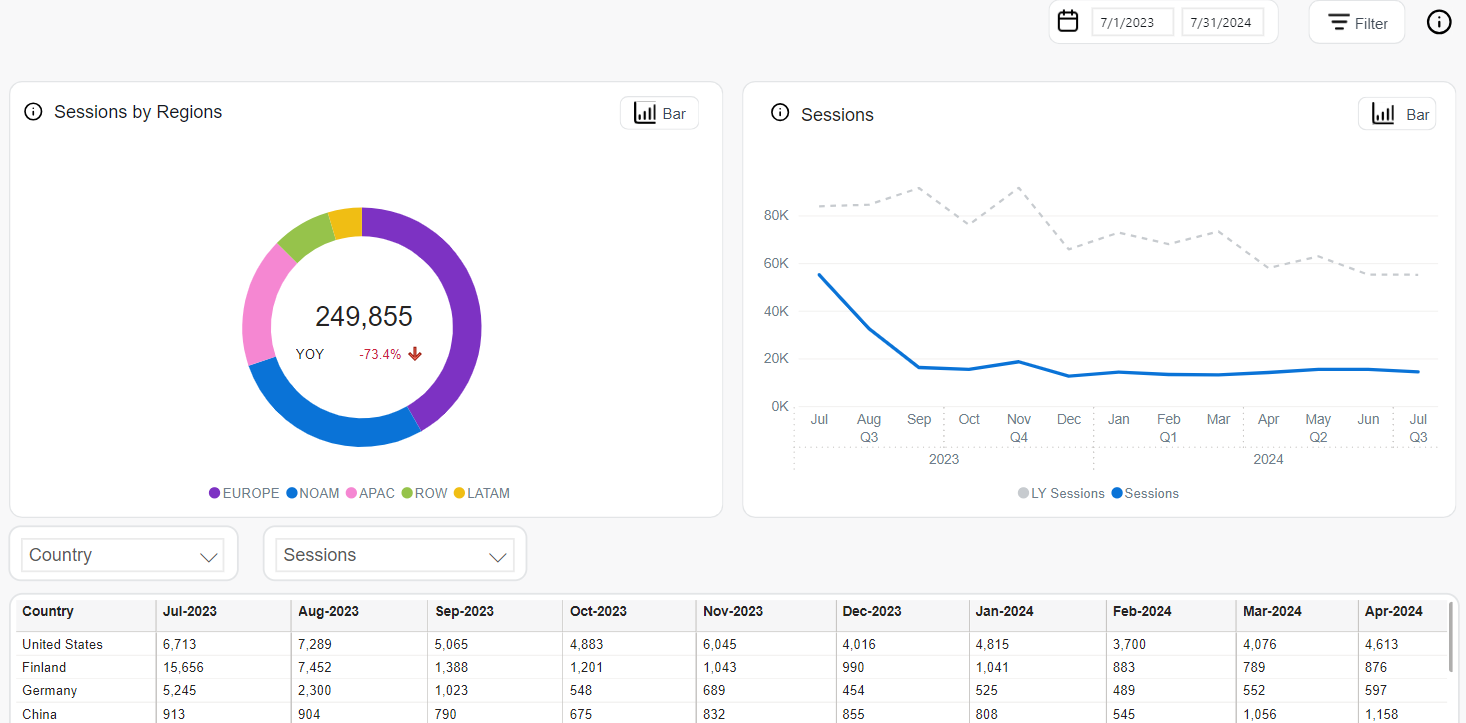
Sessions display the number of sessions the customers generated in a given period.
The Sessions by Regions pie chart displays the number of customer![]() An individual or business purchasing your product or service by placing an order through Cleverbridge. The customer is the end user of this product, as they are not allowed to resell the purchased products or services.
A customer is unique per client. If a customer purchases products or services from two different clients, there are 2 separate records of said customer. sessions among specific regions.
An individual or business purchasing your product or service by placing an order through Cleverbridge. The customer is the end user of this product, as they are not allowed to resell the purchased products or services.
A customer is unique per client. If a customer purchases products or services from two different clients, there are 2 separate records of said customer. sessions among specific regions.
The Sessions line chart displays the following data:
- Sessions: The number of sessions during the selected period
- LY Sessions: The number of sessions last year in the same period
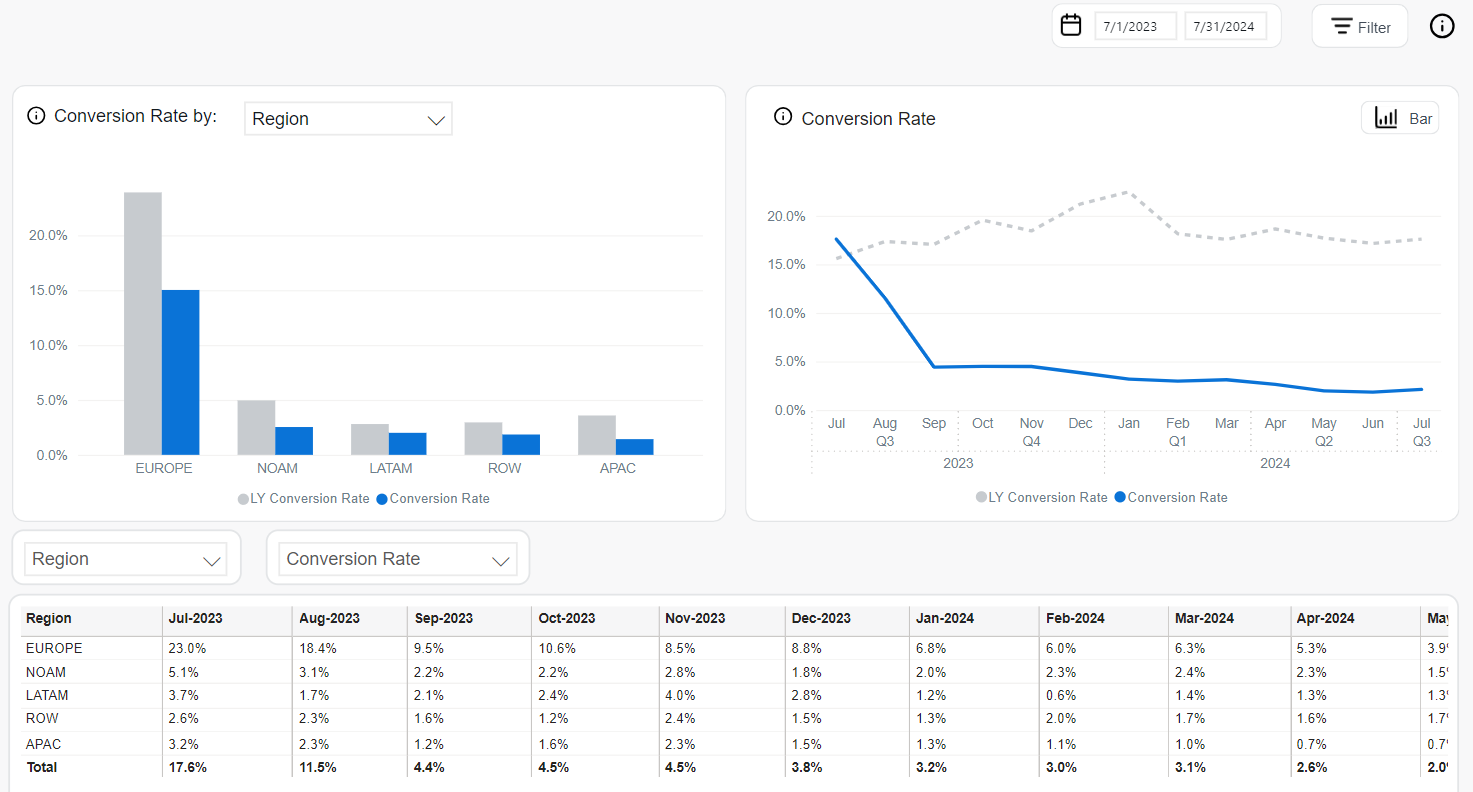
Conversion Rate is the percentage of initial orders, including non-recurring ones, successfully completed through the checkout process, divided by the total number of checkout sessions. Fraudulent transactions are excluded, but refunds are included since the rate is calculated before any refunds are processed.
The Conversion Rate bar chart displays the conversion rate filtered by one of the available dimensions, for example, region or payment type.
The Conversion Rate line chart displays the following data:
- Conversion Rate: Conversion rate during the selected period
- LY Conversion Rate: Conversion rate last year in the same period
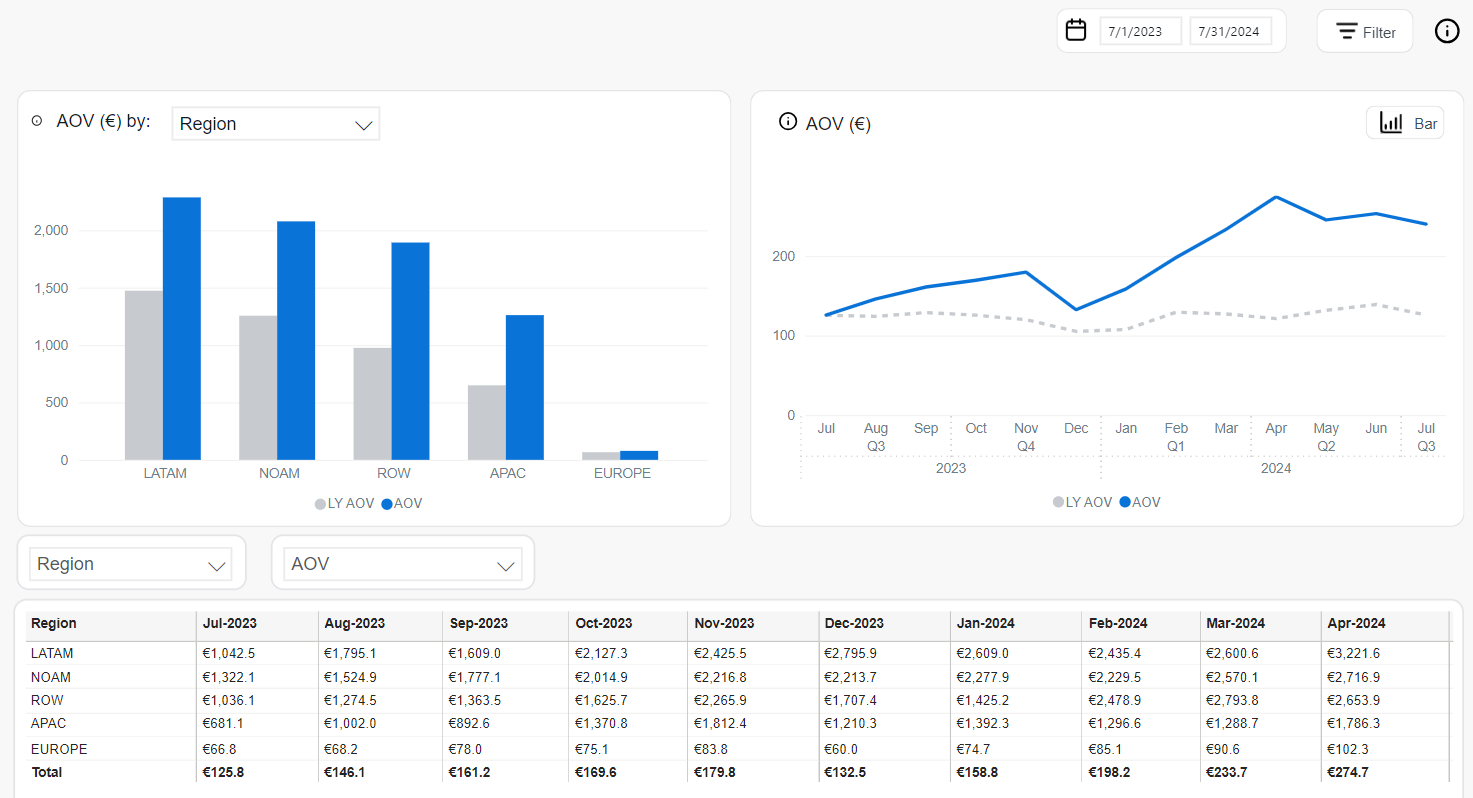
The AOV![]() Average Order Value, AOV in short, consists of the average value of all items within any given order. AOV is calculated as the net revenue divided by the number of orders paid and not reimbursed. page displays the graphs about average order
Average Order Value, AOV in short, consists of the average value of all items within any given order. AOV is calculated as the net revenue divided by the number of orders paid and not reimbursed. page displays the graphs about average order![]() An agreement between a seller and a buyer to exchange goods and/or services for money. An order can: - contain multiple products and quantities; - have multiple financial transactions. A preorder authorization is considered an order. value (AOV), which is the value of all items in the shopping cart for any given order. AOV is calculated as the net revenue divided by the number of orders.
An agreement between a seller and a buyer to exchange goods and/or services for money. An order can: - contain multiple products and quantities; - have multiple financial transactions. A preorder authorization is considered an order. value (AOV), which is the value of all items in the shopping cart for any given order. AOV is calculated as the net revenue divided by the number of orders.
The AOV bar chart displays the AOV filtered by one of the available dimensions, for example, region or payment type.
The AOVline chart display the following data:
- AOV: Average order value in the selected period
- LY AOV: Average order value last year in the same period
LTV (Customer Lifetime Value) shows the expected total revenue an average customer will generate for your business over their entire lifetime as a paying customer. LTV is calculated by dividing the average revenue per user (ARPU) by the user churn rate. The user churn rate is the percentage of subscribers who cancel their subscription during a given period. It's calculated by using the following formula: User Churn Rate = [Cancelled Subscribers / (Active Subscribers + Cancelled Subscribers)] * 100%.
The LTV bar chart shows the LTV filtered by one of the available dimensions, for example, region or payment type.
The LTV line chart shows the following data:
- LTV: LTV of the selected period
- LY LTV: LTV last year in the same period
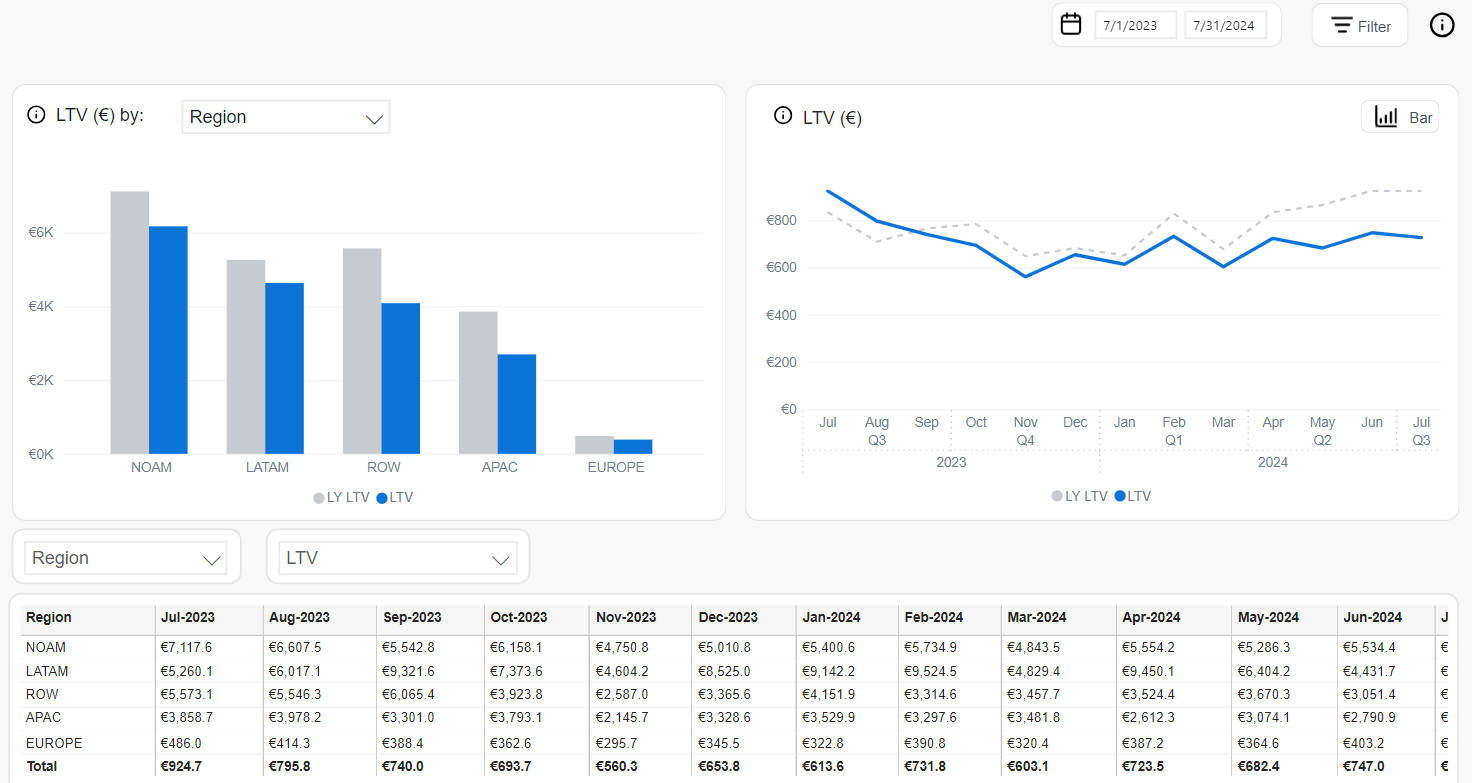
Example
For a selected company, the ARPU is $11.64, and the average churn rate is 3.1%. Using the formula, the LTV is calculated as follows:
LTV = 11.64 / 0.031 = 375.48
This means that the LTV for this company's average customer is approximately $375.48.
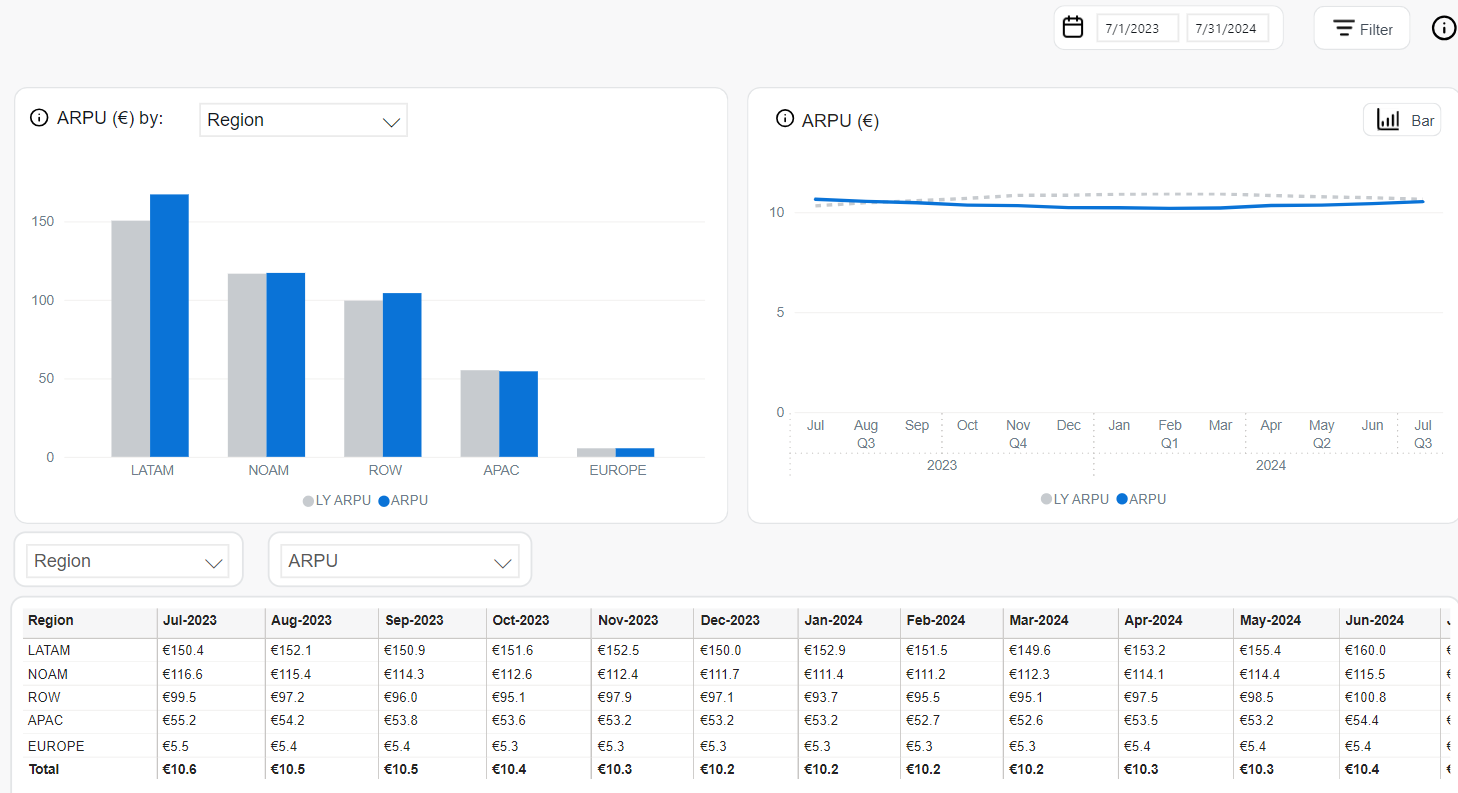
ARPU (Average Revenue per User) shows average revenue generated by one subscriber in a period. ARPU is calculated as MRR divided by active subscribers.
The ARPU bar chart shows the ARPU filtered by one of the available dimensions, for example, region or payment type.
The ARPU line chart shows the following data:
- ARPU: ARPU of the selected period
- LY ARPU: ARPU last year in the same period
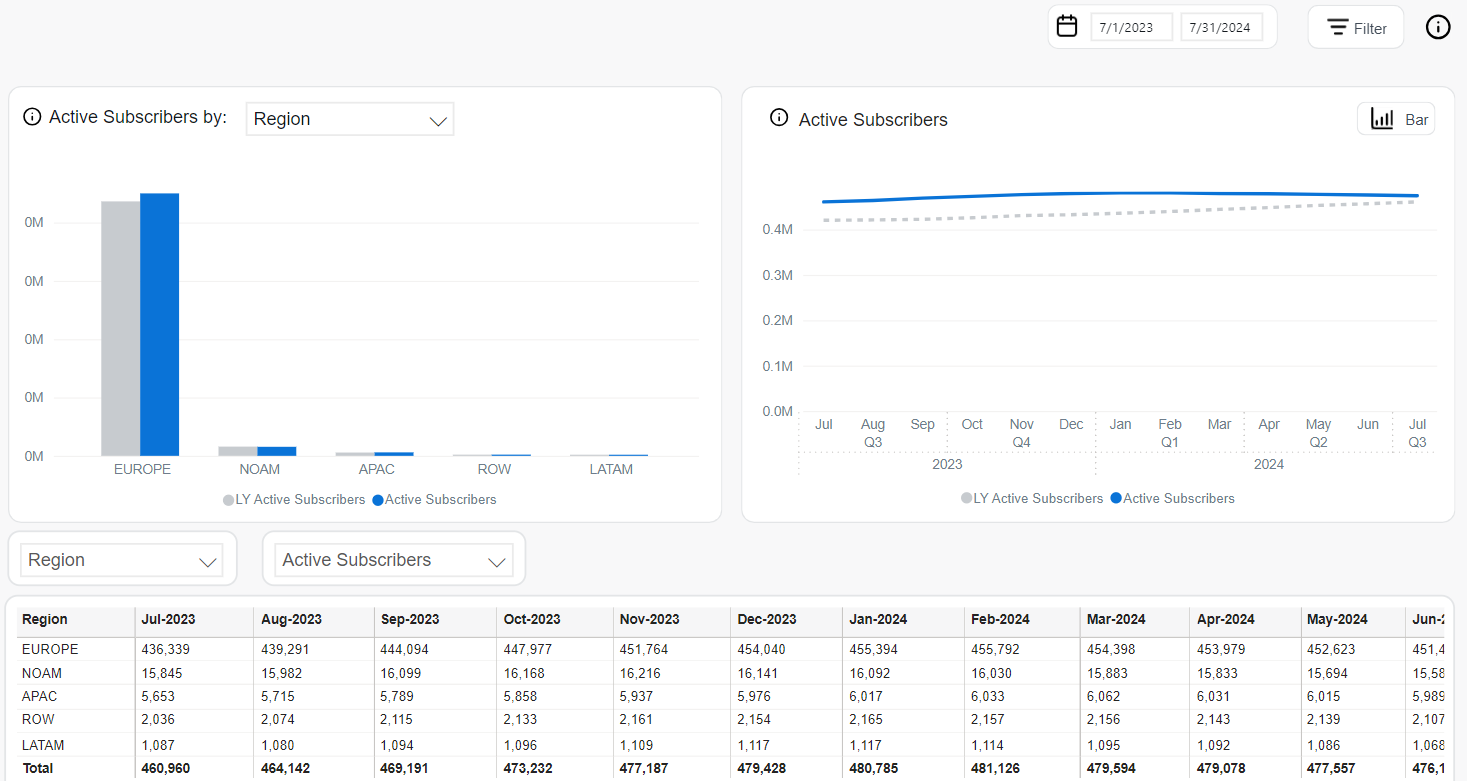
The Subscribers reports provide insights into the total number of subscribers that are either currently active or were reactivated during the selected reporting period. Each subscriber is uniquely identified using their email addresses.
The data can be broken down or filtered using various dimensions, such as Region, Payment Type, or Renewal Period, providing critical data for assessing customer retention and engagement.
Subscriber Types
To view data for a specific type of subscription, click the Active or Reactivated tab in the top-right corner of the page (located to the left of the reporting period settings)
- Active Subscribers: Unique subscribers holding at least one paid subscription item
 A subscription item is component of a subscription with its own set of attributes including price, description and feature set.. If a subscriber has multiple subscription items, they will still only be counted as one subscriber.
- Reactivated Subscribers: Unique subscribers who have returned after a period of inactivity. The following criteria ensure accurate identification of reactivated subscribers within the relevant timeframe:
- A subscriber is considered reactivated if they re-subscribe more than seven days but not more than 3 month after canceling their subscription.
- If a subscriber reactivates their subscription after a period exceeding three months, they are treated as a new subscriber.
- For subscribers with multiple subscriptions, they are only classified as reactivated if all subscriptions were canceled and at least one is renewed within the specified period.
Report Metrics
Regardless of the chosen reporting period, subscription type and breakdown dimensions, the charts display the following metrics:
- Active or Reactivated Subscribers: The number of subscribers during the selected reporting period.
- LY Active or LY Reactivated Subscribers: The number of subscribers during the same period last year
X-Parameter![]() The x-parameter is a variable appended to a URL that allows grouping and tracking orders for later reporting purposes. It also enables you to pass through data that you want to capture in the order process. X-parameters can also be used to control design elements based on the value of the x-parameter. displays origin of your revenue, subscription movements, and renewal rate as per up to five custom x-parameter classes up to ten hierarchical x-parameter levels. For more information on x-parameters, see Set Up X-Parameters. X-parameters are variables appended to the order processing URLs that let you:
The x-parameter is a variable appended to a URL that allows grouping and tracking orders for later reporting purposes. It also enables you to pass through data that you want to capture in the order process. X-parameters can also be used to control design elements based on the value of the x-parameter. displays origin of your revenue, subscription movements, and renewal rate as per up to five custom x-parameter classes up to ten hierarchical x-parameter levels. For more information on x-parameters, see Set Up X-Parameters. X-parameters are variables appended to the order processing URLs that let you:
- pass data you want to capture in the order processing, such as sources of revenue, customer information, and affiliate and partner A company that buys your products in bulk for a discounted price and resells them to their customers for a profit. In legal terms, a partner is a regular customer as there is no partnership agreement with Cleverbridge in place. information.
- group and track orders for reporting.
The various metrics on the X-Parameters bar chart help you measure how successful your different promotional activities are. For more information on how x-parameters are used to pass information through the checkout process to track revenue, see Provide Incentives for Purchase, X-Parameter and Revenue Tracking Reporting, and Set Up Revenue Tracking.
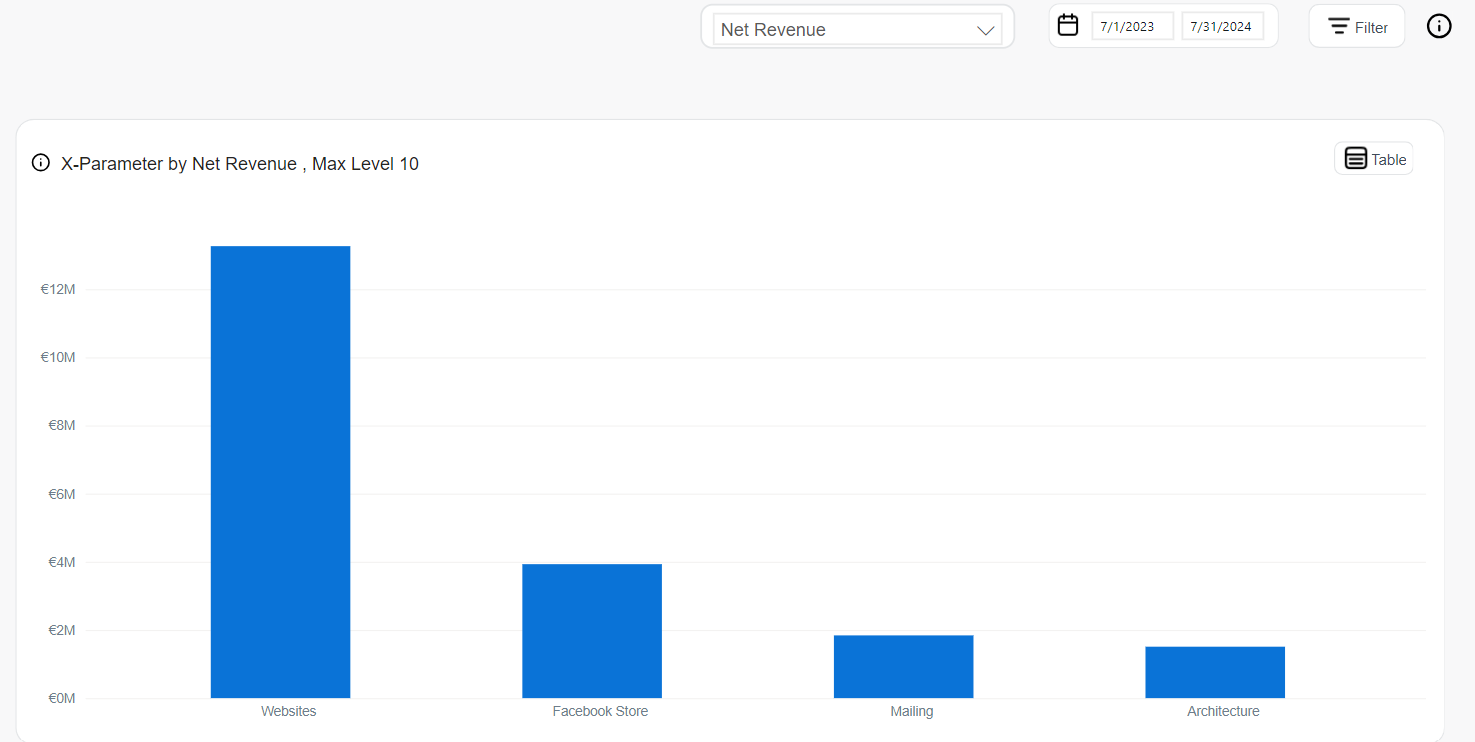
The X-parameters bar chart displays the following metrics for the 5 custom x-parameter classes, which you can drill down to see further x-parameter sub-levels:
- Net Revenue
- New Subscription Items
- Renewed Subscription Items
- Churned Subscription Items
- Orders
- AOV
- Renewal Rate
- Refund Rate
- Chargeback A credit card chargeback, typically referred to as chargeback, occurs when a customer successfully disputes a transaction on their bank report. Unlike a refund, where Cleverbridge proactively returns the amount to the customer, a chargeback involves the customer's bank automatically withdrawing the amount from Cleverbridge's account. Cleverbridge can contest illegitimate claims, but the card organization makes the final decision. Successfully contested chargebacks still contribute to the chargeback ratio. Rate
- Conversion Rate
The Table tab displays the entire data used to calculate the metrics of the x-parameter bar charts including the x-parameter classes and their sub levels. You can also view the x-parameter table to see the five custom parameter classes and their sub-levels.
Important
To use x-parameters metrics and x-parameter filters, first you need to create the x-parameter categories and subcategories in the system. Only then the data gets populated in the x-parameter page and the x-parameter filters.
3. Subscriptions
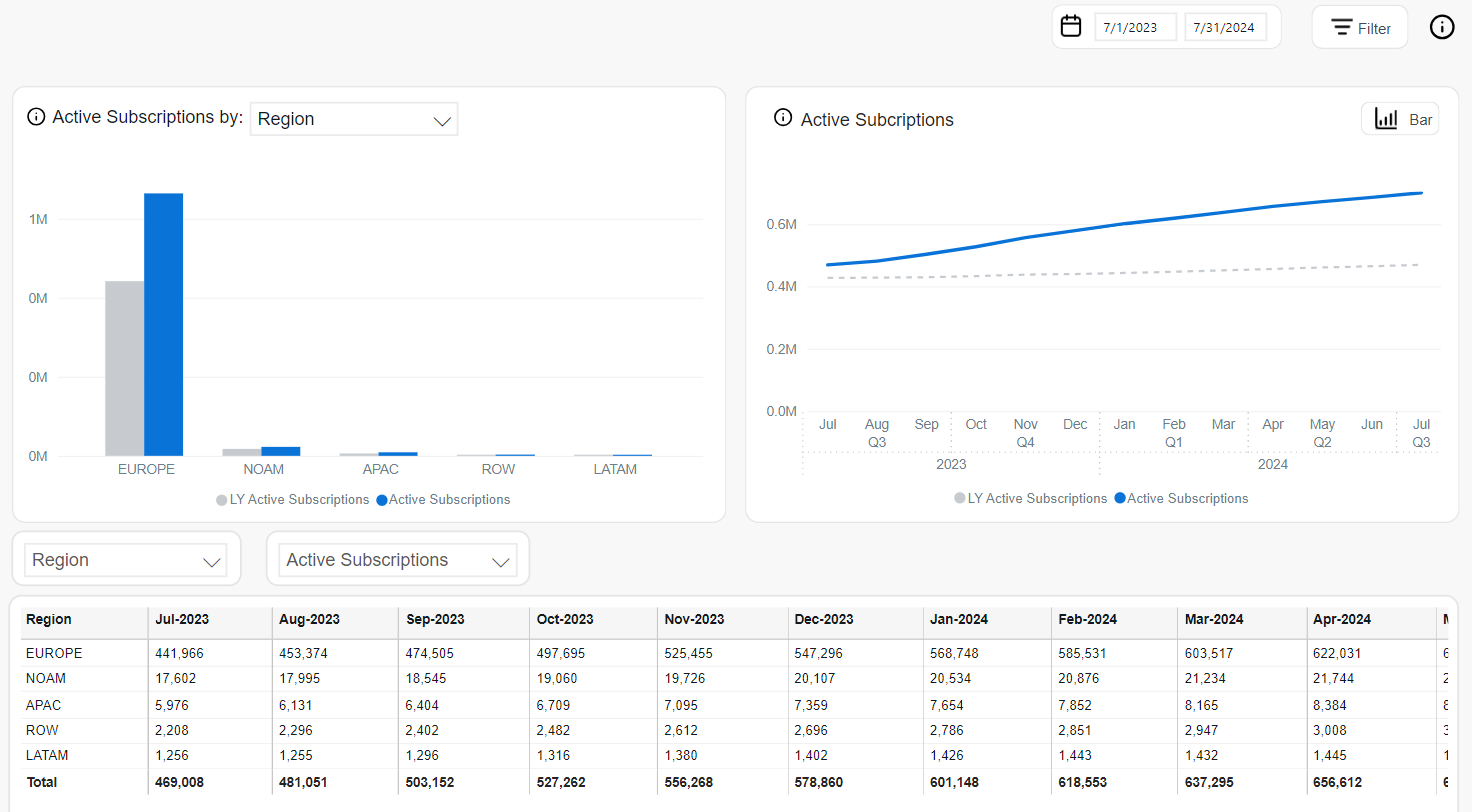
The Active and Reactivated Subscriptions reports provide insights into the total number of paid subscription items that are either currently active or were reactivated during the selected reporting period. A subscription item is a recurring product that is billed at regular intervals, such as monthly or yearly.
The data can be broken down or filtered using various dimensions, such as Region or Payment Type, allowing for a detailed analysis of subscription trends across different categories and providing critical data for assessing customer retention and engagement.
Subscription Types
To view data for a specific type of subscription, click the Active or Reactivated tab in the top-right corner of the page (located to the left of the reporting period settings)
- Active: The number of active paid subscriptions at the end of the reporting period.
- Reactivated: The number of paid subscriptions that were reactivated after a period of inactivity.
A subscription is considered reactivated if the customer resubscribes more than seven days but not more than three months after canceling their subscription. If the subscription is reactivated after a period exceeding three months, it is treated as a new subscription.
Report Metrics
Regardless of the chosen reporting period, subscription type and breakdown dimensions, the charts display the following metrics:
- Active or Reactivated Subscriptions: The number of subscriptions during the selected reporting period
- Active or Reactivated Subscriptions LY: The number of subscriptions during the same period last year
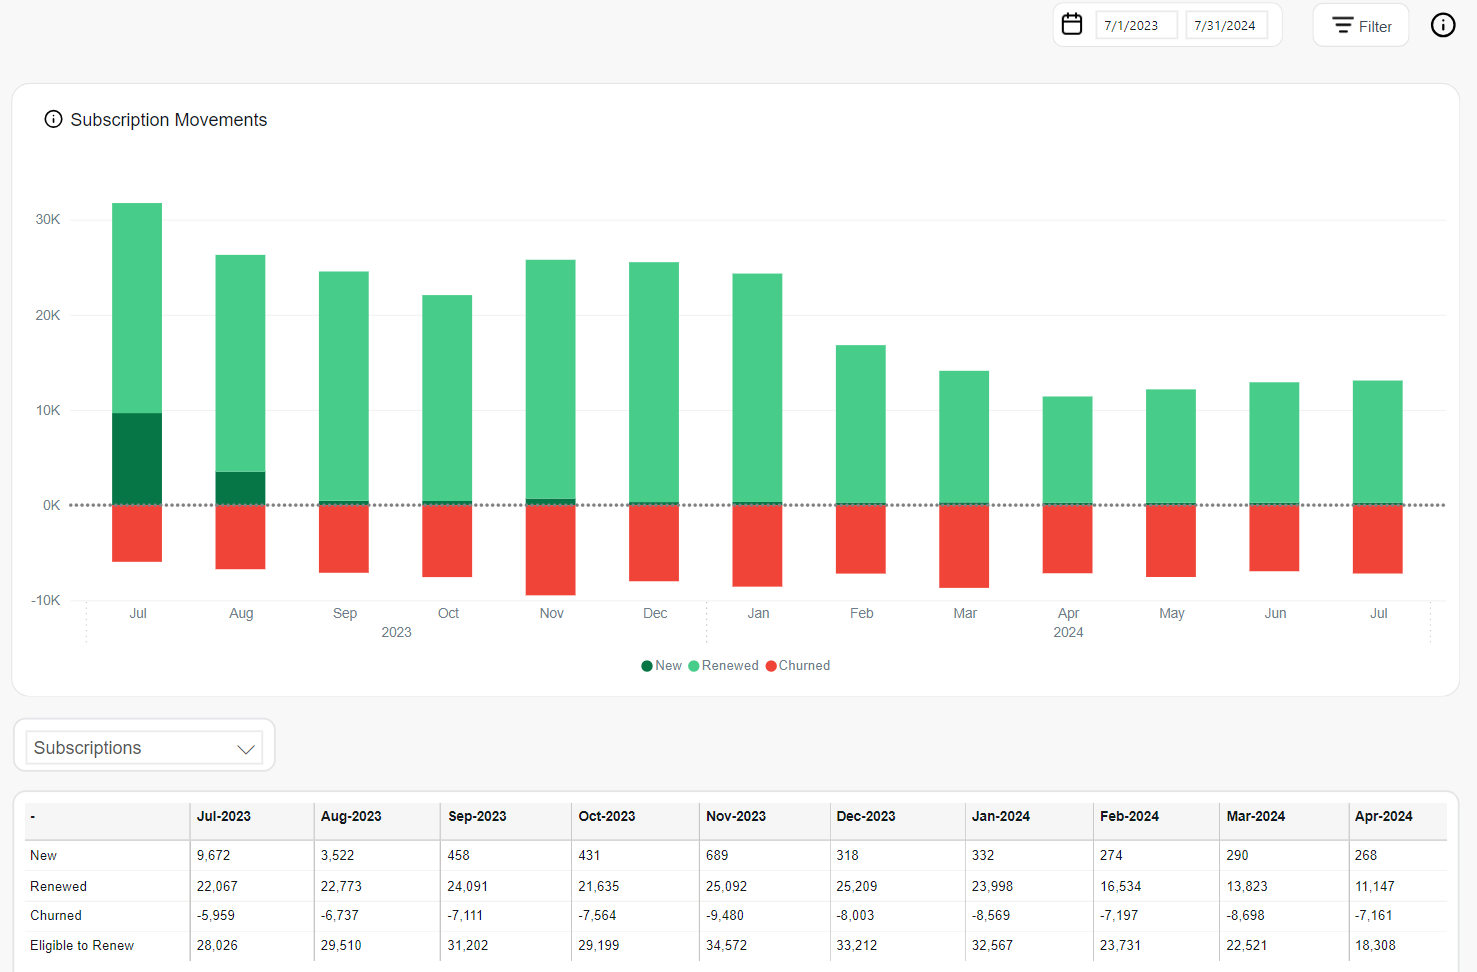
The Movements bar chart displays the changes in the number of subscription items over a certain period of time, specifically showing the growth or decline in the number of new subscription items. The chart displays the following metrics:
- New: active, paid subscription items with the first payment having occurred in a period.
- Renewed: subscription items, which were paid to extend the access to a product or a service beyond the initial purchase. This value corresponds to the count of distinct subscription items where subscription interval > 0.
- Churned: subscription items that have not been renewed in a given period of time. In other words, it is a scheduled renewal that did not occur on or before the expected payment date, which results in the loss of an existing subscription item.
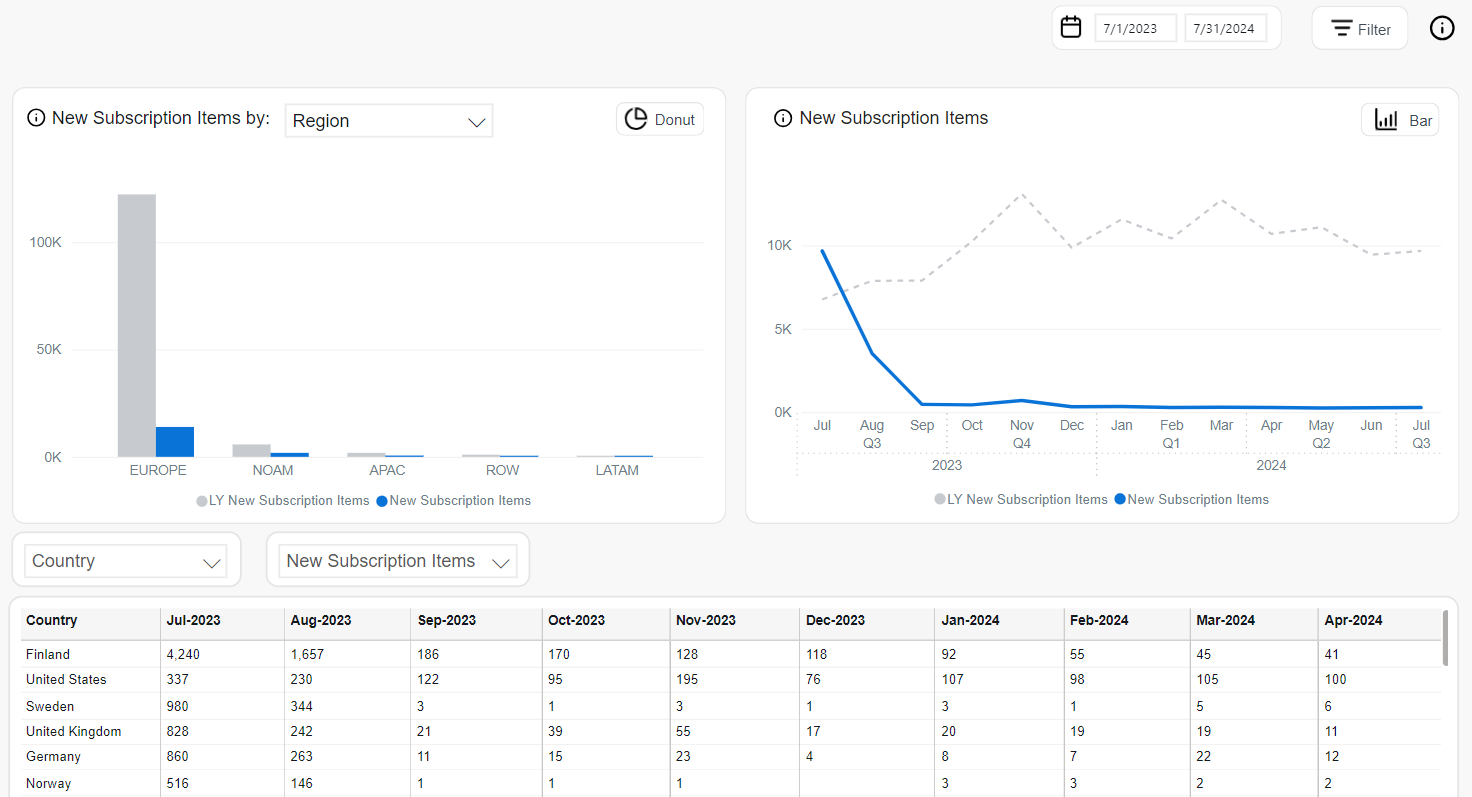
The New Subscription Items pie chart shows the number of new subscription items filtered by one of the available dimensions, for example, region or business category.
The New Subscription Items line chart shows the following data:
- New Subscription Items: New subscription items during the selected period
- LY New Subscription Items: New subscription items during the same period last year
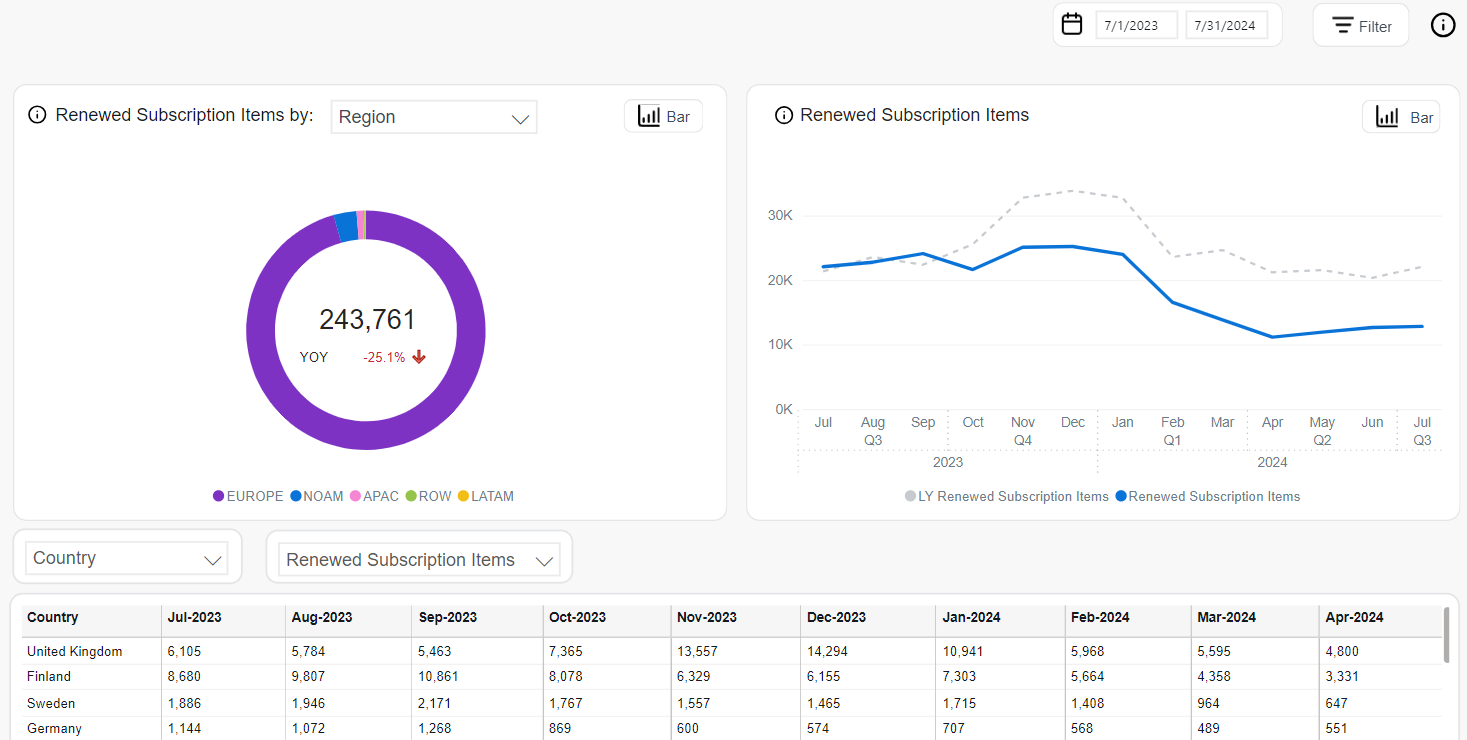
The Renewed Subscription Items pie chart shows the number of renewed subscription items filtered by one of the available dimensions, for example, region or business category.
The Renewed Subscription Items line chart shows the following data:
- Renewed Subscription Items: Renewed subscription items during the selected period
- LY Renewed Subscription Items: Renewed subscription items during the same period last year
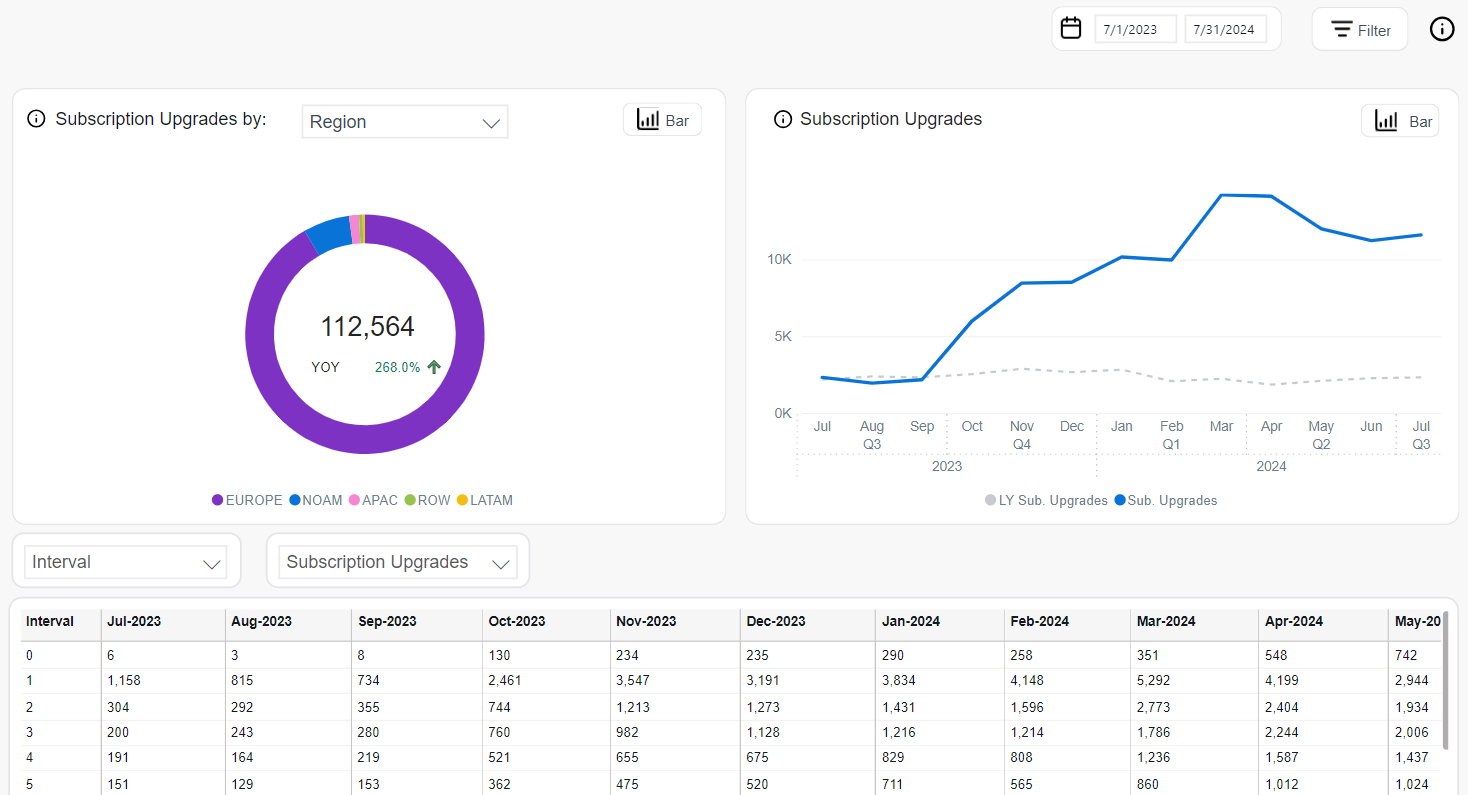
Subscription Upgrades show the total number of subscriptions where customers switched to a more expensive paid plan.
The system identifies upgrades by comparing subscription prices between consecutive billing periods:
-
The customer switched the product to a different one (
PRODUCT_IDchanged) with a higher plan price (cross-sell). -
The
customer increased the quantity for the same product (
SI_QUANTITYchanged), resulting in a higher total price (upsell).
The Subscription Upgrades pie chart shows the number of subscription upgrades filtered by one of the available dimensions, for example, region or payment type.
The Subscription Upgrades line chart shows the following data:
- Sub. Upgrades: Subscription upgrades during the selected period
- LY Sub. Upgrades: Subscription upgrades during the same period last year
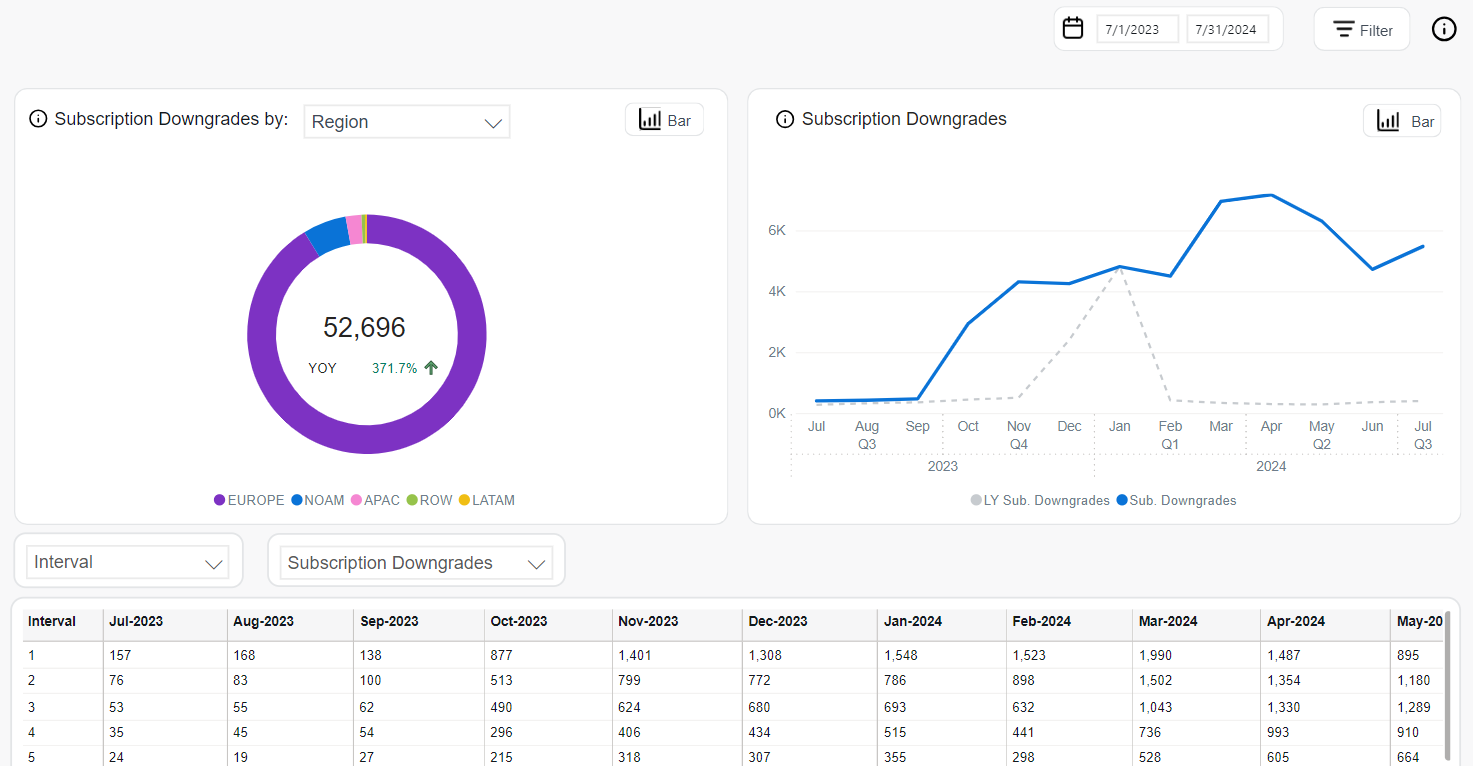
Downgrades show the total number of subscriptions where customers switched to a less expensive paid plan.
The system identifies downgrades by comparing subscription prices between consecutive billing periods:
-
The customer switched to a different product (
PRODUCT_IDchanged) with a lower plan price. -
The
customer reduced the quantity of the same product (
SI_QUANTITYchanged), resulting in a lower total price.
The Downgrades pie chart shows the number of subscription downgrades filtered by one of the available dimensions, for example, region or payment type.
The Downgrades line chart shows the following data:
- Sub. Downgrades: Subscription downgrades during the selected period
- LY Sub. Downgrades: Subscription downgrades during the same period last year
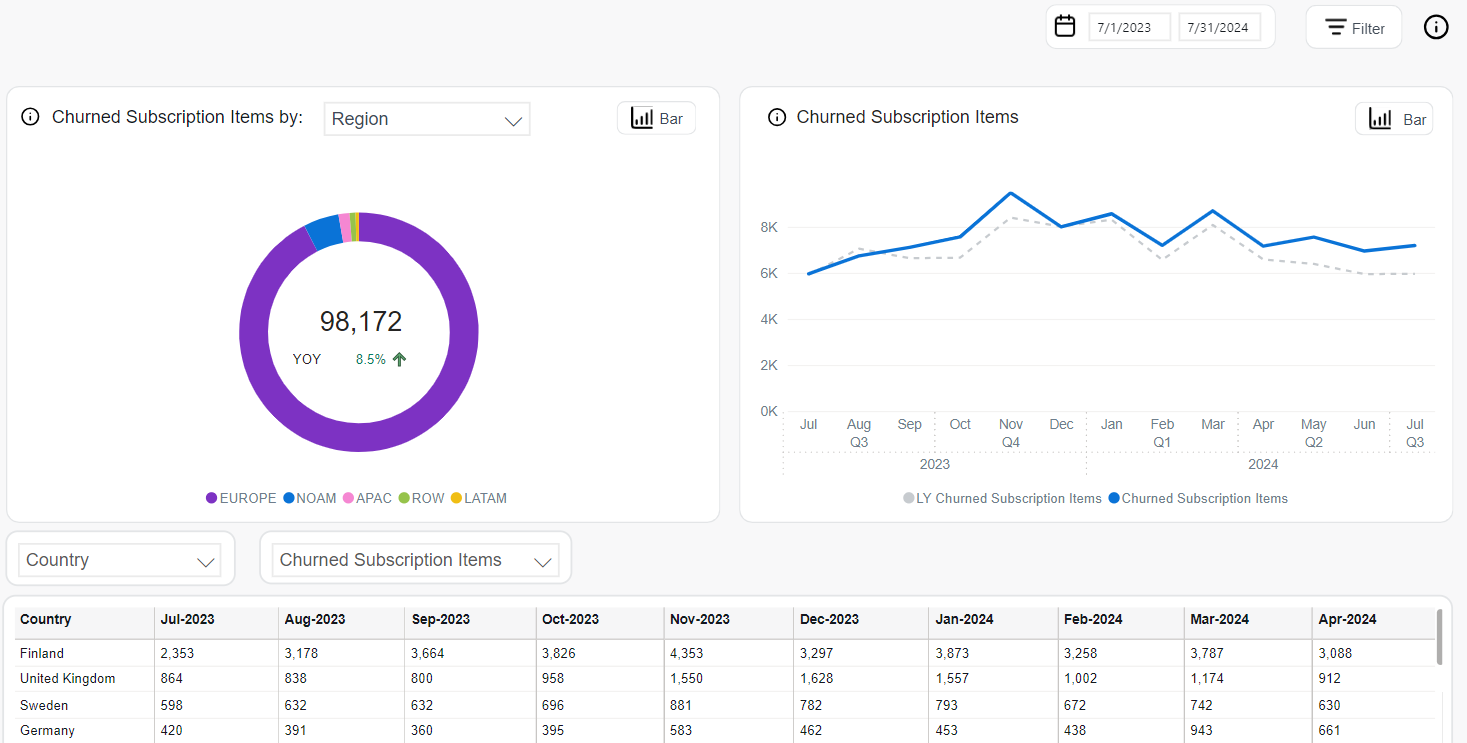
The Churned Subscription Items pie chart shows the number of churned subscription items filtered by one of the available dimensions, for example, region or business category.
The Churned Subscription Items line chart shows the following data:
- Churned Subscription Items: Churned subscription items during the selected period
- LY Churned Subscription Items: Churned subscription items during the same period last year
4. Retention
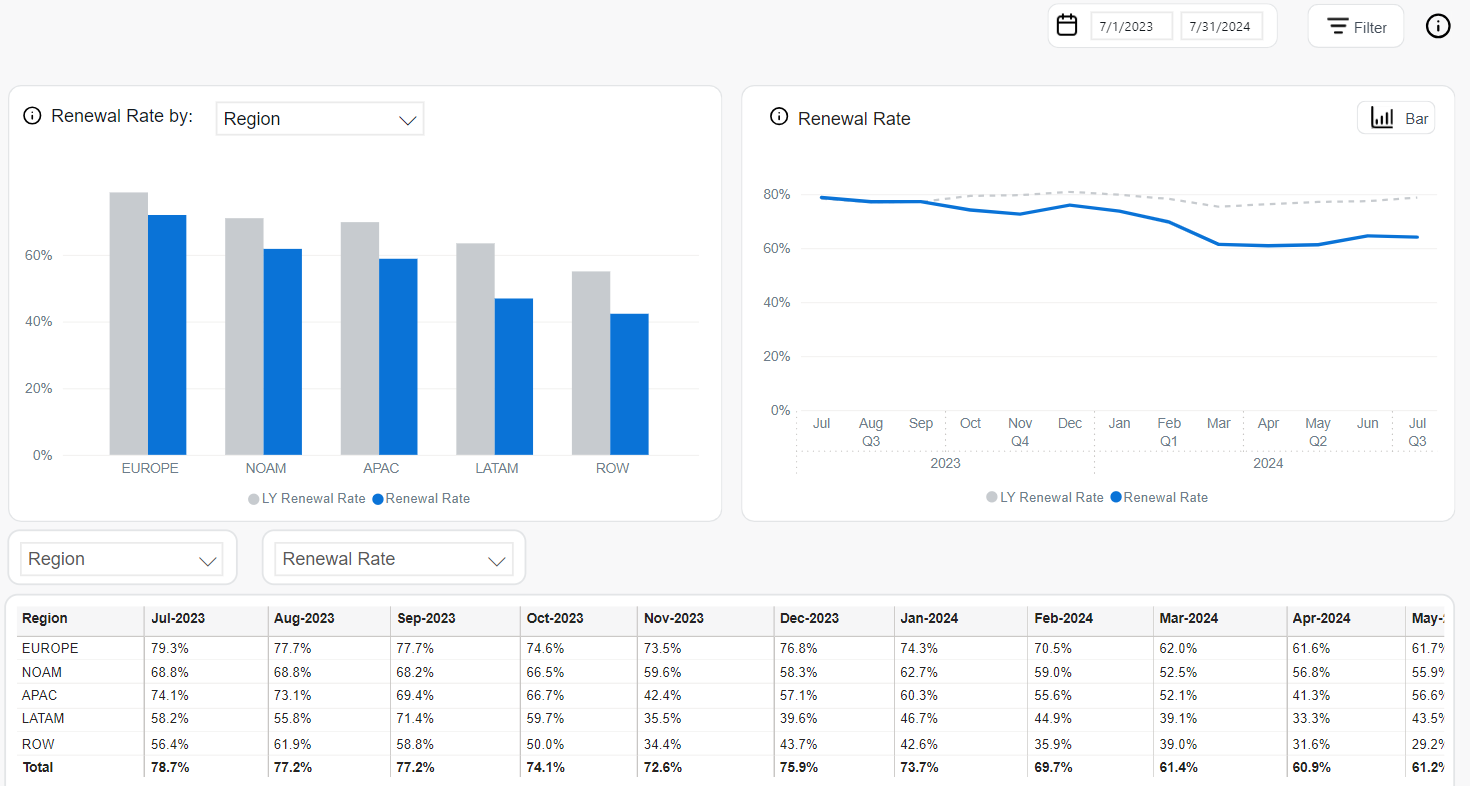
Renewal rate shows the percentage of subscription items that have been renewed from the total number of items eligible for renewal in a given period. Grace period is considered, and trial subscriptions are not included.
The Renewal Rate bar chart shows the renewal rate filtered by one of the available dimensions, for example, region or payment type.
The Renewal Rate line chart shows the following data:
- Renewal Rate: Renewal rate for the selected period
- LY Renewal Rate: Renewal Rate last year in the same period
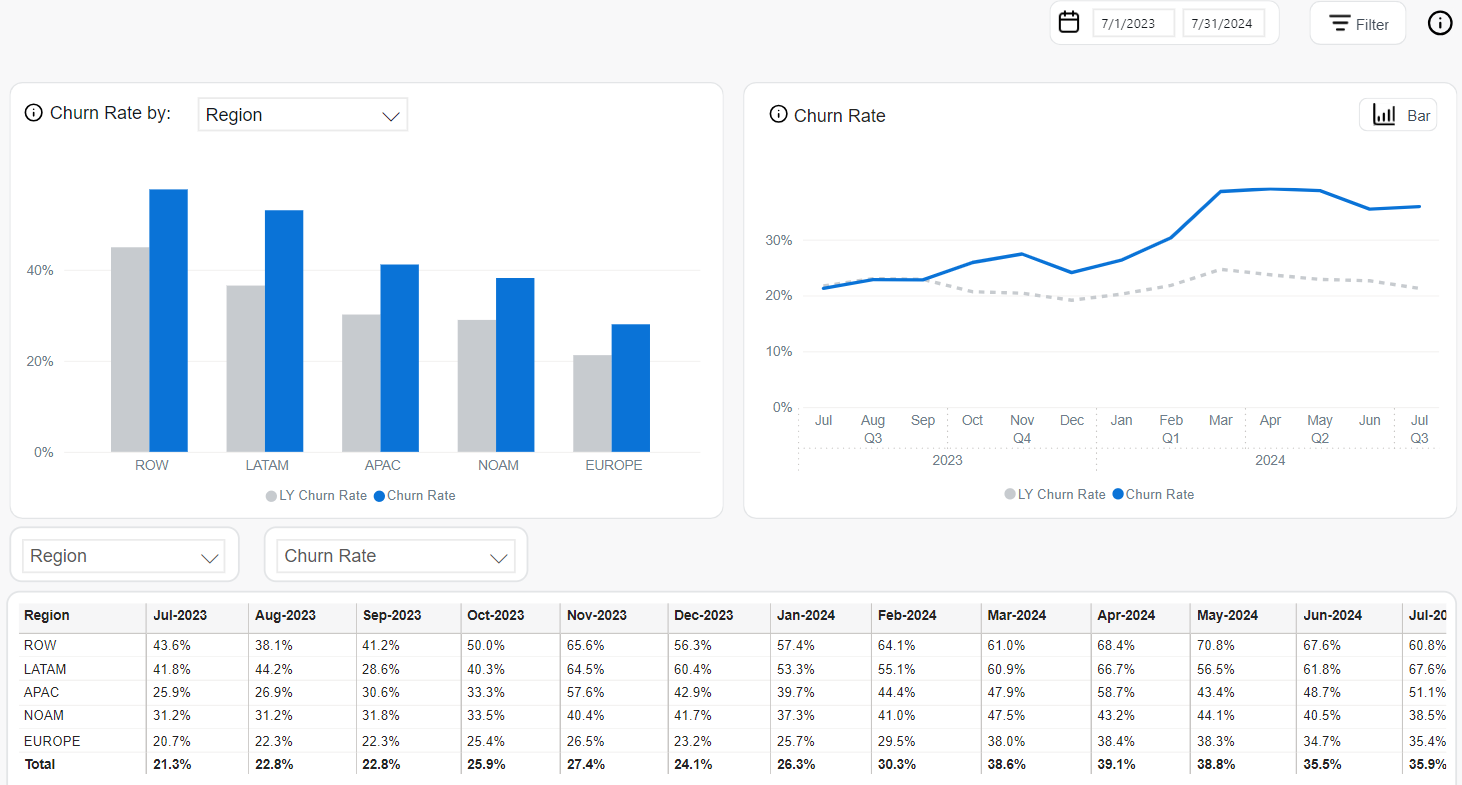
Churn Rate shows the percentage of subscription items that have not been renewed from the active subscription items in a given period. Grace period is considered, and trial subscription items are not included.
The Churn Rate bar chart shows the data filtered by one of the available dimensions, for example, region, payment type, or renewal period.
The Churn Rate line chart shows the following data:
- Churn Rate: Churn rate during the selected period
- LY Churn Rate: Churn rate during the same period last year
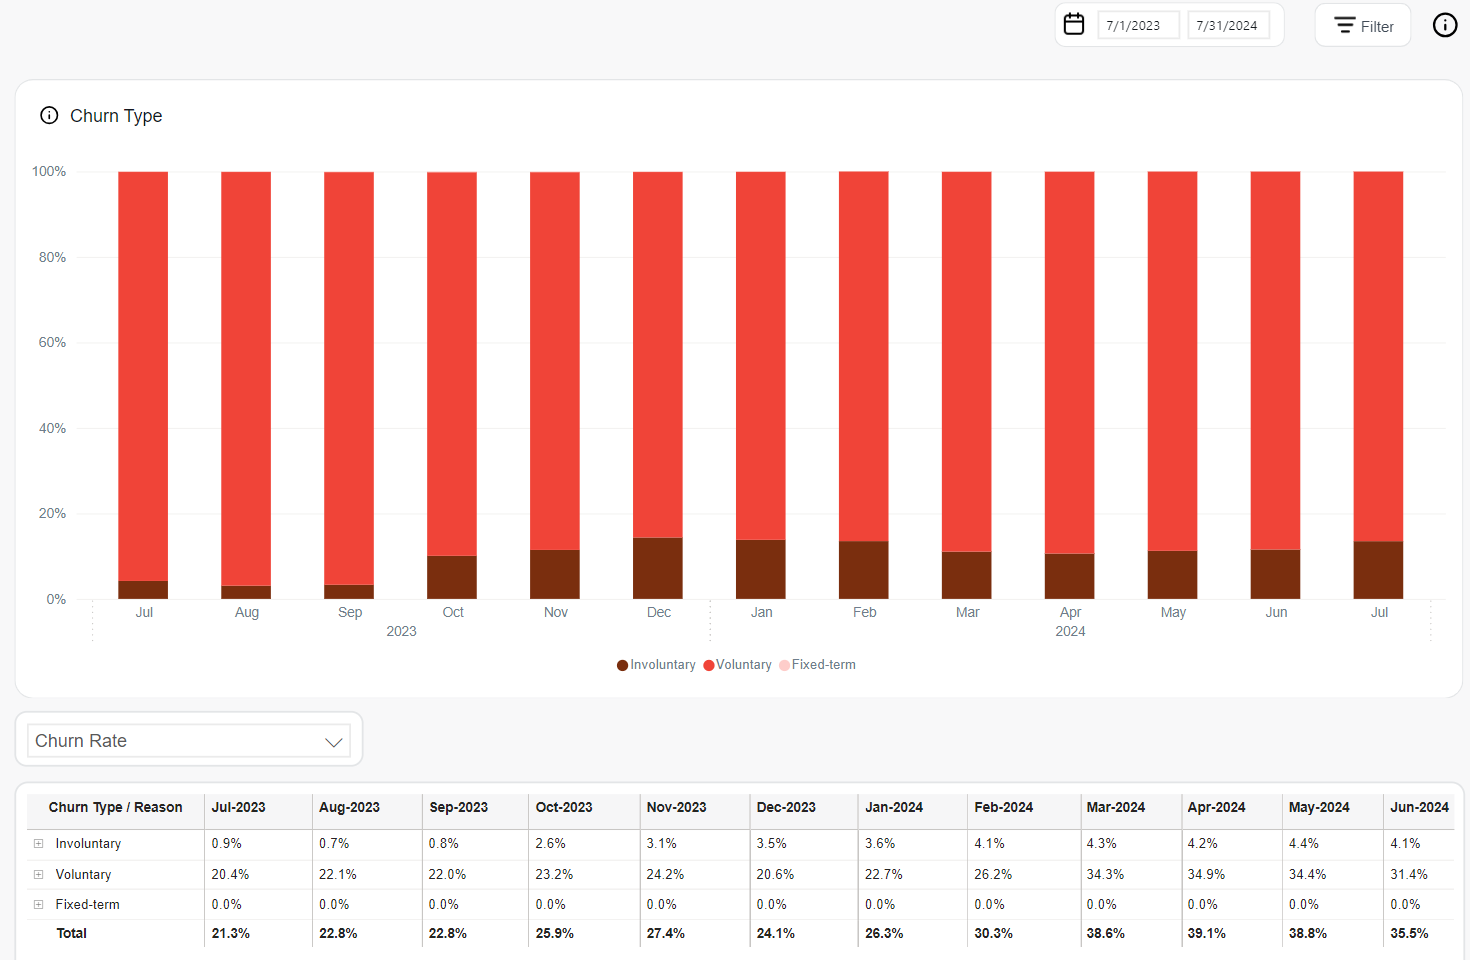
Churn Type categorizes the churn of subscribers and provides insights behind customer attrition. Whether voluntary, involuntary, or fixed-term, the underlying reasons for each churn type can be identified, tracked, and investigated for improved customer success. The churn data reflects subscription renewals that already occurred.
There are four types of churn:
- Voluntary Churn occurs when a subscriber purposefully cancels a subscription item. The reasons for voluntary churn are the following:
- Customer Cancellation: The customer opted out of renewing the subscription item before or during the renewal process.
- Manual Subscription: The customer did not give their consent to renew the subscription item after the grace period reached its end. For more information on subscription renewal types, see Subscription Life Cycle Events.
- Refund: The customer requested a refund right after the successful renewal process of the subscription.
- Chargeback: The customer didn’t recognize the transaction on their bank statement right after the successful renewal process of an automatic subscription. They requested reimbursement from their bank thereafter.
- Involuntary Churn occurs when the renewal payment for a subscription item is not received by the renewal date for one of the following reasons:
- Outdated Payment Information
- Failed Account Connection
- Insufficient Funds
- Offline Payment: During the renewal process, the transaction using an offline payment method wasn't successfully processed.
- Fixed-term Churn occurs when a subscription item has a hard-set expiration date. This means that the subscription item will automatically be canceled at the end of a contract period because of special circumstances like discontinuing a product or seizing business altogether with an embargoed country. The reasons for fixed-term churn are the following:
- External Reason: The subscription item churns out due to external reasons such as export regulations and compliance, discontinued product, terminated client ID, or API call with flag to terminate.
- Limited Renewals: The subscription item churns out after a predetermined number of renewals.
- Bounced Mail: The subscription item churns out following an undelivered email to the customer and high risk of chargeback is suspected.
- Churn handled by Client occurs when clients independently manage subscriptions, which is executed via API call by using the Deactivate Subscription Items endpoint.
Note
The renewal type is independent of the payment method![]() Describes the actual payment method used by the customer to complete the purchase, for example, Visa, wire transfer, or SEPA Direct Debit. selected by the customer. If an item churns while being renewed manually and paid for by an offline payment
Describes the actual payment method used by the customer to complete the purchase, for example, Visa, wire transfer, or SEPA Direct Debit. selected by the customer. If an item churns while being renewed manually and paid for by an offline payment![]() Offline payment stands for a group of payment options that do not involve online transactions like direct debit, wire transfers, and checks. With the order confirmation, the customer receives a link with information on how to make the payment. Ordered products are delivered as soon as Cleverbridge receives payment confirmation from the payment provider. method simultaneously, the registered churn reason for the item churn is manual subscription.
Offline payment stands for a group of payment options that do not involve online transactions like direct debit, wire transfers, and checks. With the order confirmation, the customer receives a link with information on how to make the payment. Ordered products are delivered as soon as Cleverbridge receives payment confirmation from the payment provider. method simultaneously, the registered churn reason for the item churn is manual subscription.
Note
The manual subscription churn reason outranks offline payment. This means that if an item churns while being paid for by an offline payment and the subscription is renewed manually by the customer, the reason for the item churn is manual subscription and not offline payment.
Churn cohort is a powerful feature for subscription businesses to understand user behavior, to measure user retention/churn, and get insights into customer lifetime value (CLV). Subscription items are grouped into cohorts based on an interval basis (month or year) at the moment of sign-up. Consequently, the churn rate is calculated for each upcoming subscription interval respectively.
Churn rate of subscription items over various subscription intervals in a given period. Cohort groups a set of subscription items by the time of their sign-up, the unifying factor being the month of the sign-up. Grace period is considered, and trial subscription items are not included in the calculation.
The subscription item has churned out when the billing date is overdue and the subscription item hasn't been renewed.
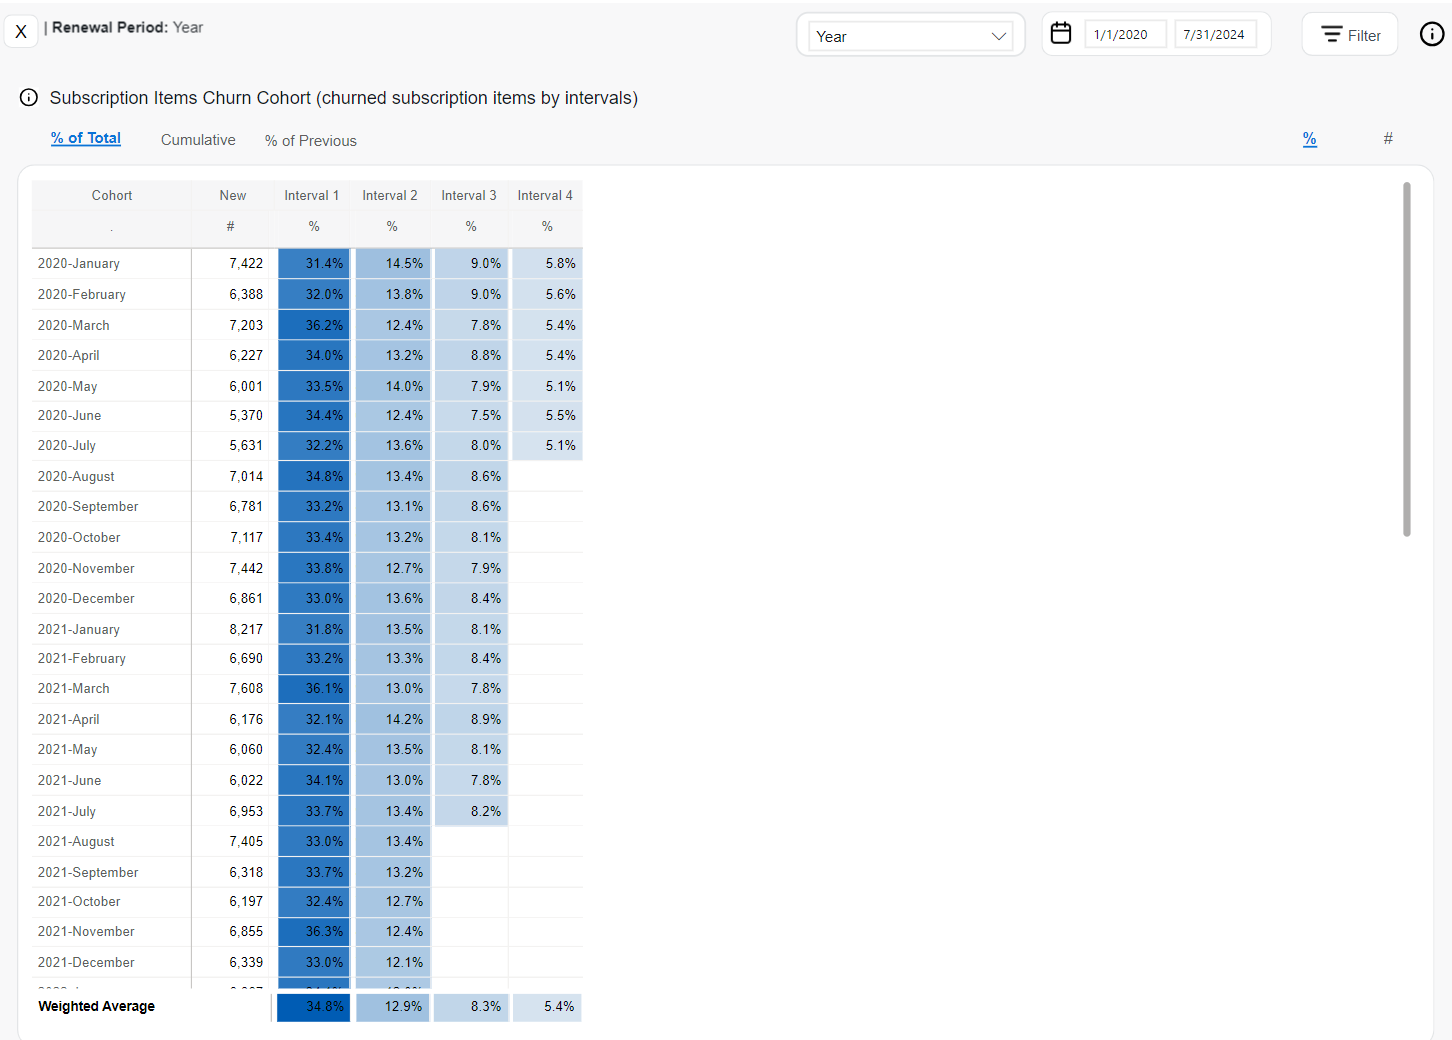
The % of Total table shows the following data:
- In the rate % view: the percentage of subscription items that churned out in each interval. The total number of subscription items from the New column makes the 100%. See the example below for more details.
- In the count # view: the total number of subscription items that churned out in each interval, see the example below for more details.
The Cumulative table shows the following data:
- In the rate % view: the percentage of subscription items that churned out in all previous and current intervals. The total number of subscription items from the New column makes the 100%. See the example below for more details.
- In the count # view: the sum of subscription items that churned out in all previous and current intervals.
The % of Previous table shows the percentage of churned subscription items from previous months retained in each interval.
5. Refunds
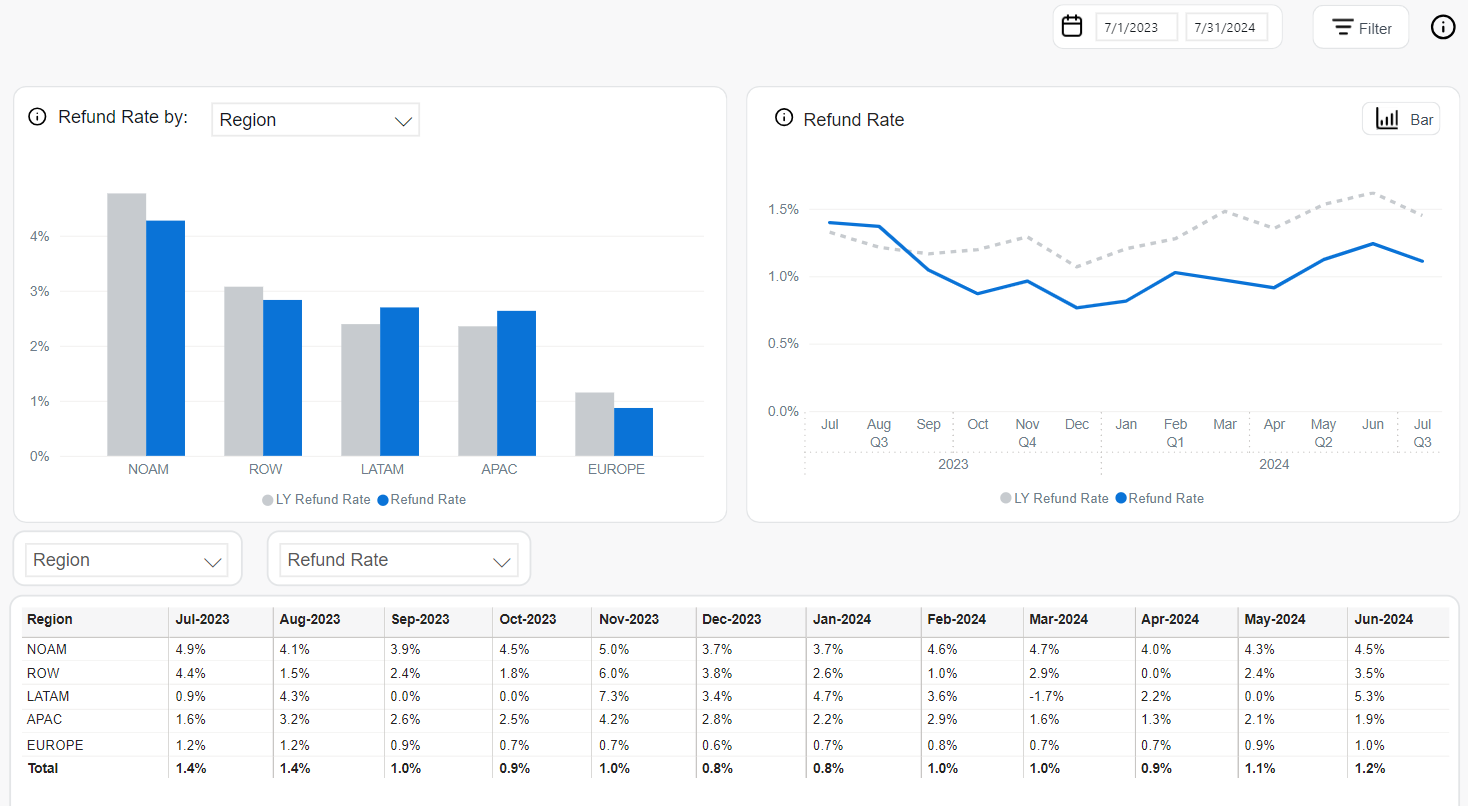
Refund Rate displays the percentage of transactions that were fully or partially refunded during the selected period.
The Refund Rate bar chart shows the refund rate filtered by one of the available dimensions, for example, region or payment type.
The Refund Rate line chart display the following data:
- Refund Rate: Refund rate during the selected period
- LY Refund Rate: Refund Rate during the same period last year
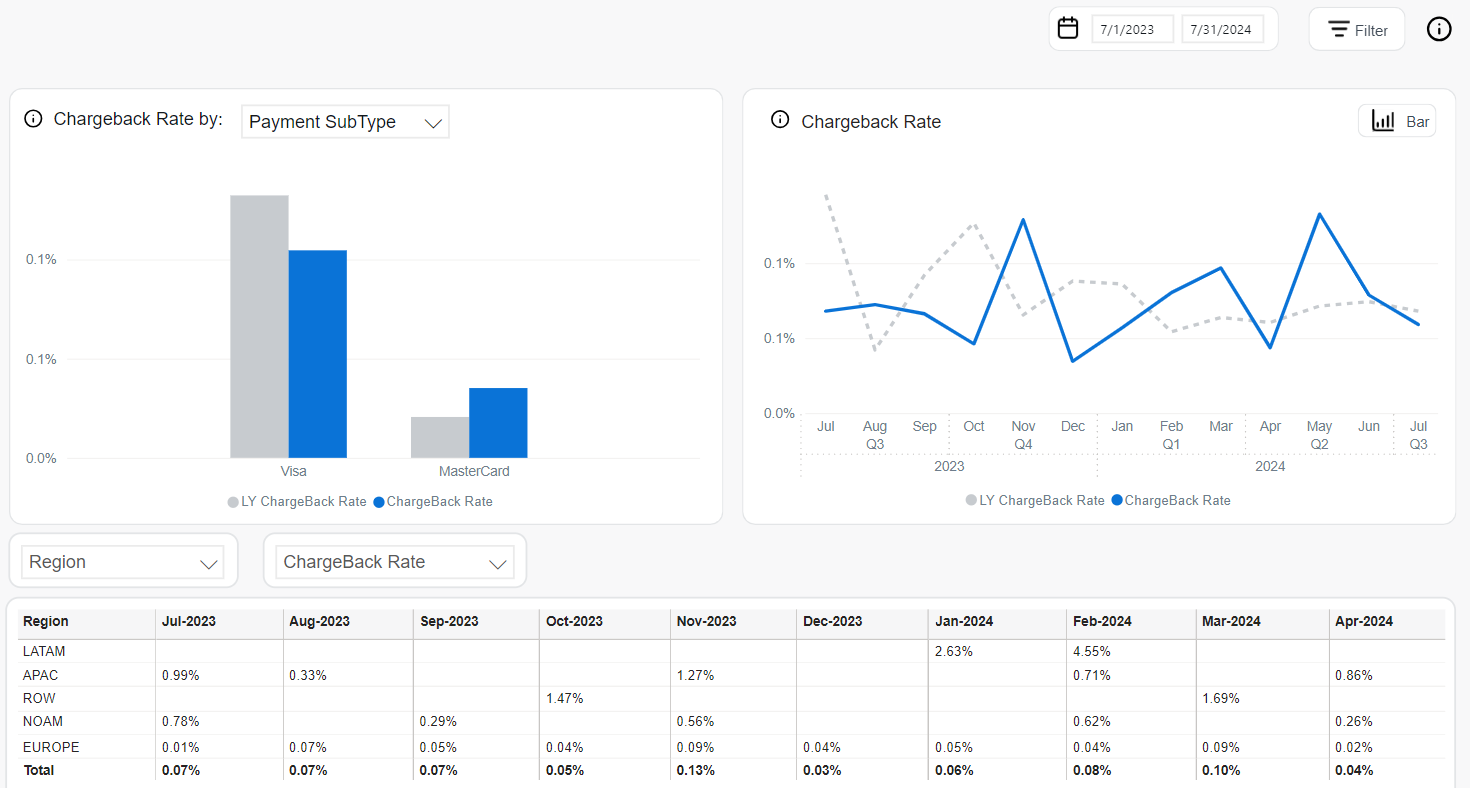
CC Chargeback Rate displays sum of Visa and Mastercard chargebacks processed in the current month divided by the sum of all paid transactions processed by Visa in the current month and all paid transactions processed by Mastercard during the previous month.
The Chargeback Rate bar chart displays the chargeback rate filtered by one of the available dimensions, for example, region or payment type.
The Chargeback Rate line chart displays the following data:
- Chargeback Rate: Chargeback rate during the selected period
- LY Chargeback Rate: Chargeback rate last year in the same period
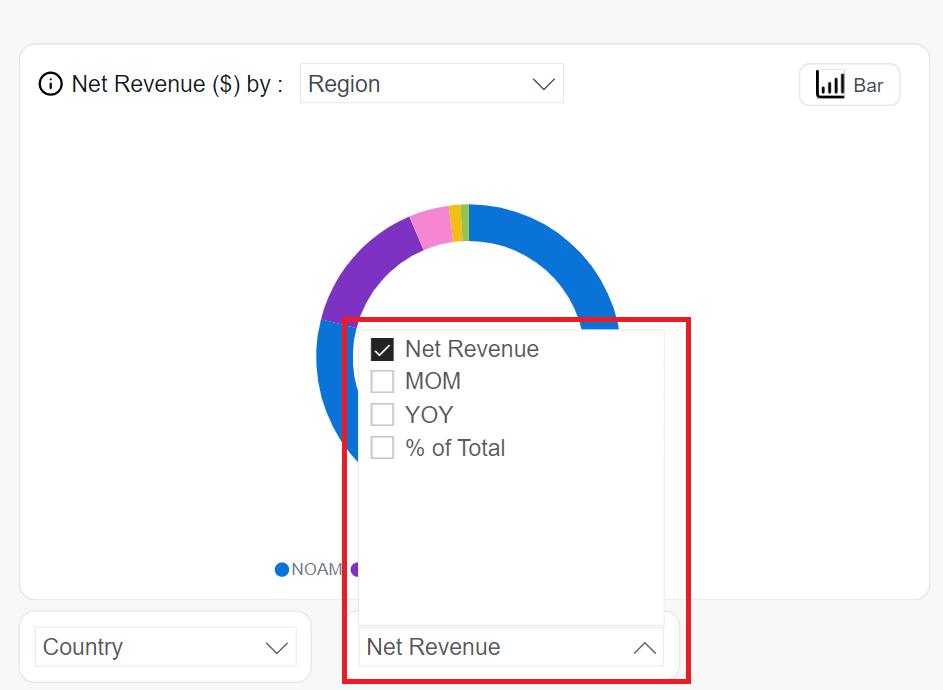
Flexible Views
In the Subscriptions dashboard, you can view all metrics by different dimensions in both table and chart formats.
Additionally, you can configure your tables with columns for value, YoY, MoM, and Total %.
Filters
In the Subscriptions dashboard, you can apply common filters to the results across all pages.
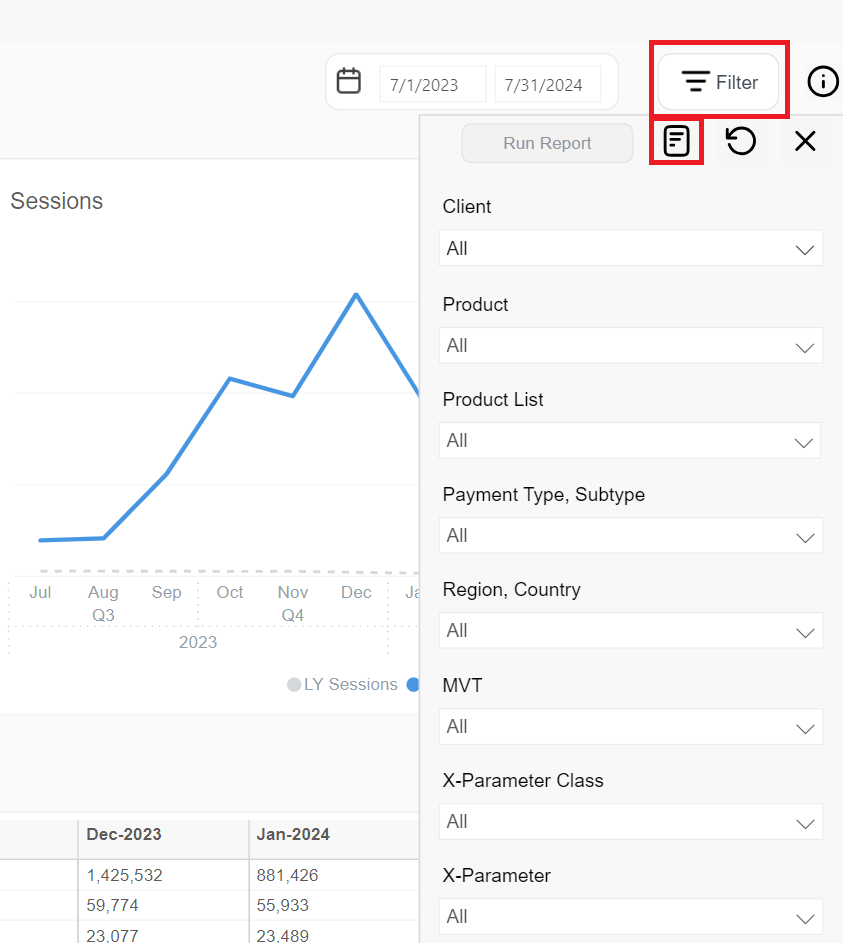
You can also filter data by specific IDs using text search filters.
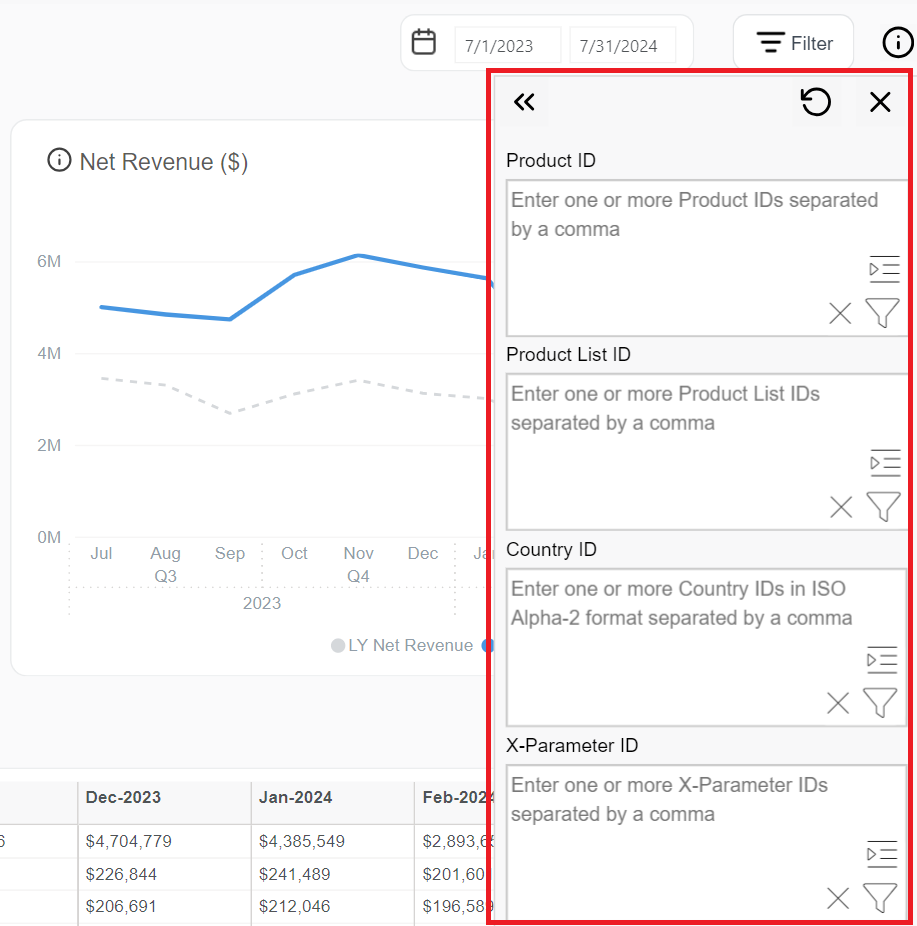
The applied filters are visible above the charts and can be cleared with the X sign.
You can filter the data by:
- Date Range: Month-day-year
- Client: Cleverbridge client name/ID
- Currency: USD, EUR, or GBP
- Product: Name/ID of the product
- Product List: Name/IDs of product lists
- Recurrence:Type of the product, either recurring or non-recurring
- Renewal Period: Monthly, yearly, or other subscription running periods
- Interval: Subscription item interval number
- Payment Type, Subtype: Payment type and subtype used by a customer
- Region, Country: World region as defined by Cleverbridge and billing country
- Australia
- China
- Hong Kong
- India
- Indonesia
- Japan
- Malaysia
- New Zealand
- Philippines
- Republic of Korea
- Singapore
- Taiwan
- Thailand
- Vietnam
- Albania
- Austria
- Belarus
- Belgium
- Bosnia and Herzegovina
- Bulgaria
- Canary Islands
- Croatia
- Cyprus
- Czech Republic
- Denmark
- Estonia
- Finland
- France
- Germany
- Greece
- Hungary
- Iceland
- Ireland
- Italy
- Latvia
- Liechtenstein
- Lithuania
- Luxembourg
- Macedonia
- Malta
- Monaco
- Montenegro
- Netherlands
- Norway
- Poland
- Portugal
- Republic of Moldova
- Romania
- Russian Federation
- San Marino
- Serbia
- Slovakia
- Slovenia
- Spain
- Sweden
- Switzerland
- Ukraine
- United Kingdom
- Argentina
- Bolivia
- Brazil
- Chile
- Colombia
- Costa Rica
- Ecuador
- El Salvador
- Guatemala
- Honduras
- Mexico
- Nicaragua
- Panama
- Paraguay
- Peru
- Puerto Rico
- Uruguay
- Venezuela
- Canada
- United States
- Business Category: B2C or B2B
- MVT Multivariate testing (MVT) is a technique for testing two or more different variables in the checkout process to determine which variable creates more revenue or a higher conversion rate.: Multivariate testing campaign name/ID
- Partner: Another business that buys your products in a B2B model. Partners purchase your products at a discount and then sell them to customers. Partners communicate directly with customers.
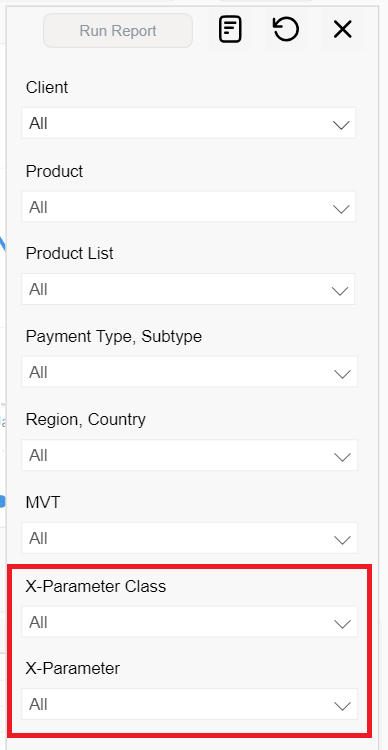
- X-Parameter Class: These are your predefined x-parameter classes. You can have a maximum of 5 x-parameter classes per client in the system. When you select an X-Parameter Class filter, it is applied to the metrics and the x-parameters under the x-parameter class appear in the X-Parameter filter drop-down, which you can further select to filter the metrics. You can select either one x-parameter class as a filter or all the available x-parameter classes.
- X-Parameter: X-Parameter represents origin of your revenue and subscriptions and there can be a maximum of 10 hierarchical x-parameters levels in the system. You can select X-Parameter filters to see the subscription/revenue reports. You can either select one x-parameter as a filter or all the available x-parameters. For more information on x-parameters, see Set Up X-Parameters, X-Parameter and Revenue Tracking Reporting, and Set Up Revenue Tracking.
| Cleverbridge Region | Countries |
|---|---|
| APAC |
|
| EUROPE |
|
| LATAM |
|
| NOAM |
|
| ROW | All others |
Tip
To quickly find a specific campaign in a long list of entries in the X-Parameter field, utilize the search feature by typing in either the name or ID of the campaign for which you wish to filter the data.
Important
In the Subscriptions dashboard, you can apply X-Parameter Class and X-Parameter filters only to the following metrics:
- Revenue > Net Revenue
- Subscriptions > Movements, New, Renewed, and Churned
- Churn > Churn Rate and Churn Type
- Customer Acquisition > Orders and AOV
- Performance > All metrics
- Engagement > Sessions
Top N Values
Within the Subscriptions dashboard, for pages with a single metric, you can view the Top N values for generated tables wherever dimension selection is available.
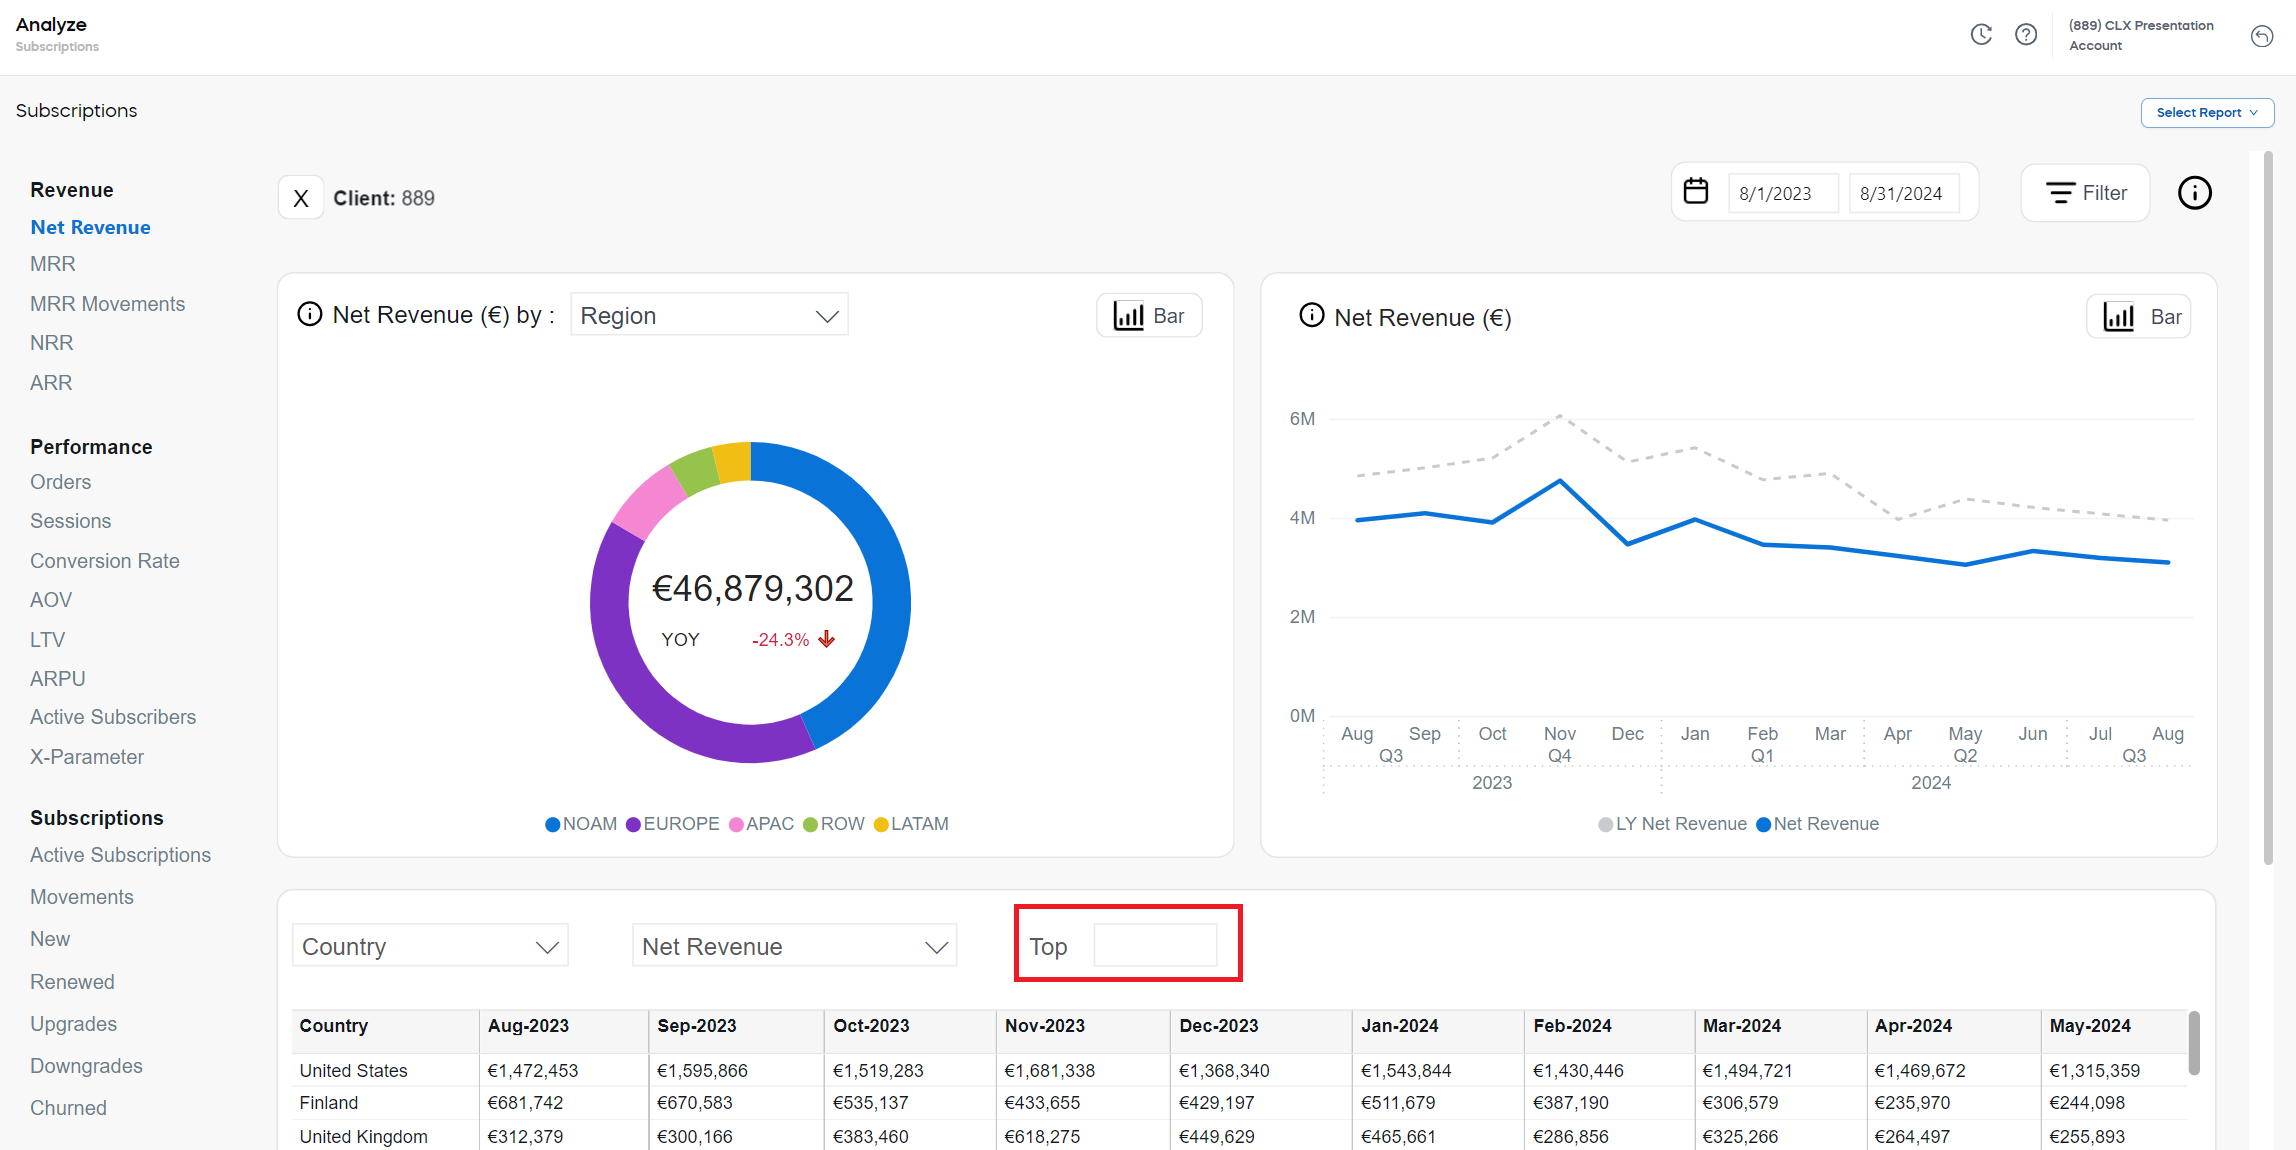
Chart Features
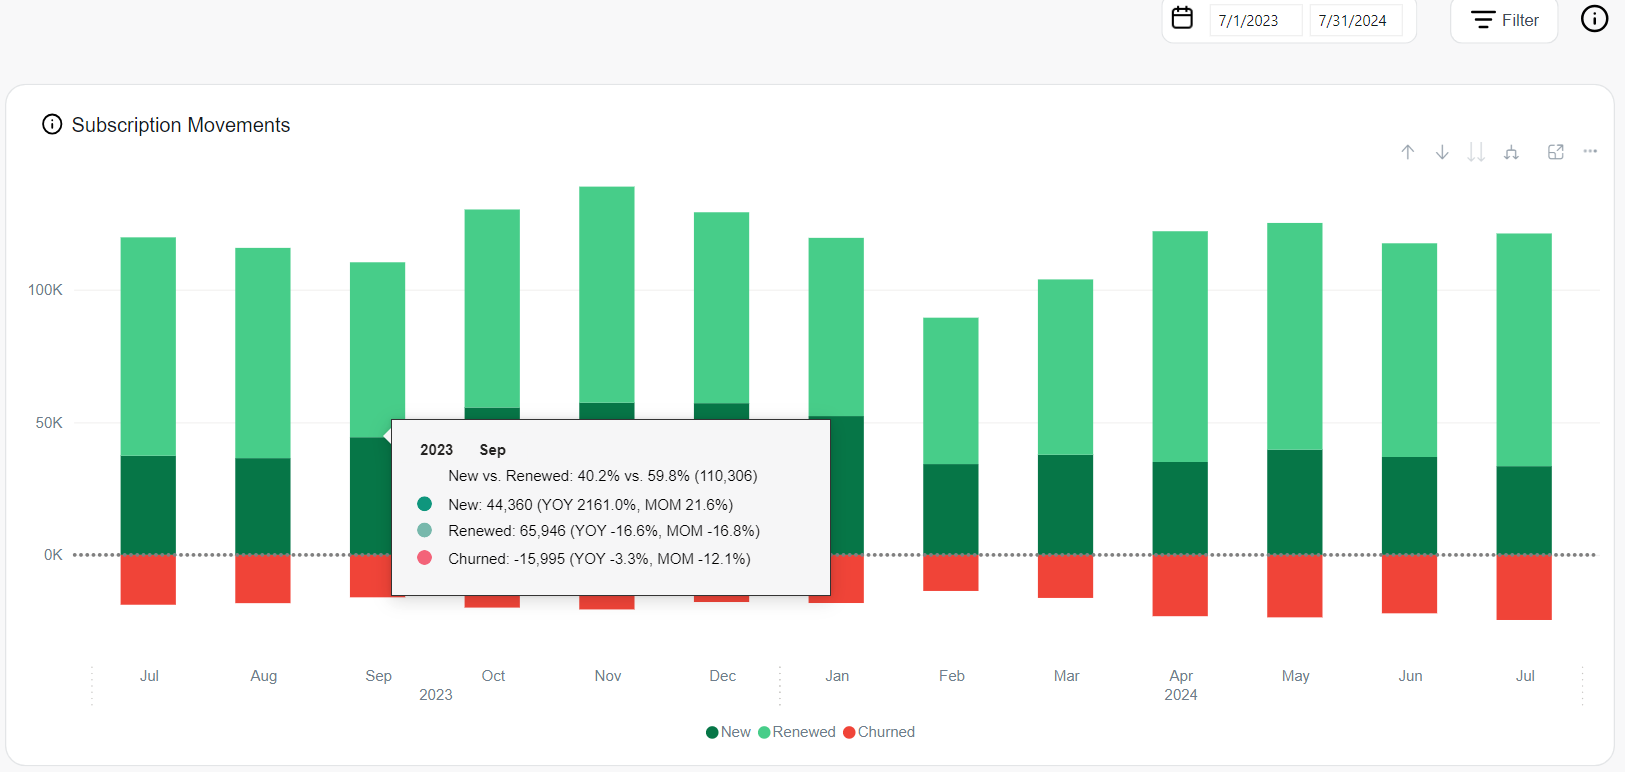
Hovering over each chart’s title displays a brief explanation of the shown KPI and how it is calculated.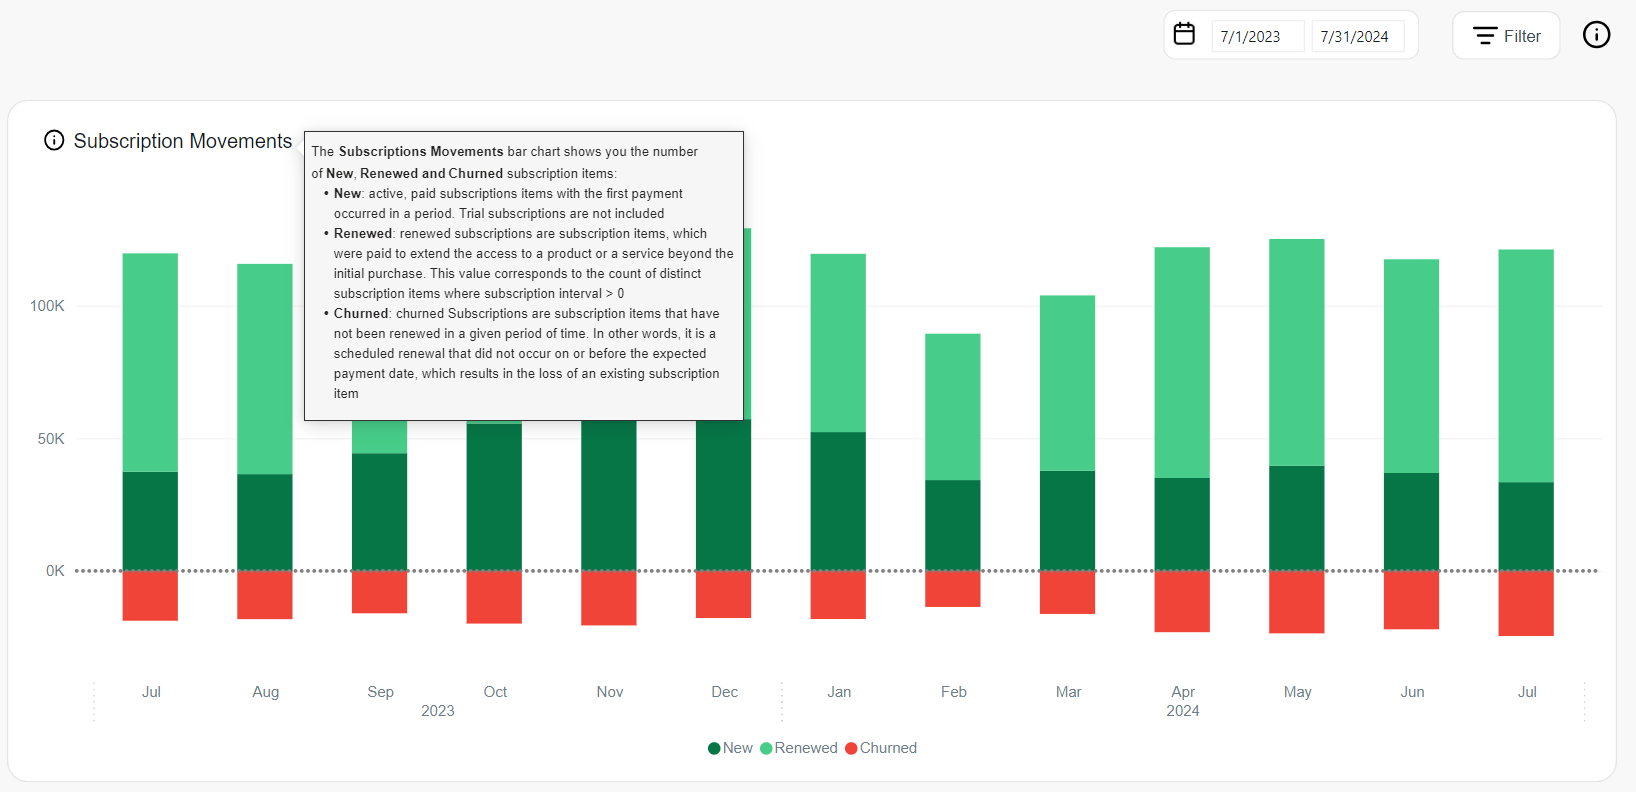
Hovering over any of the bars or lines in any of the charts, gives you more detailed data. For instance, the Subscription Movements chart displays the following data for the month of September 2023:
You can drill up, drill down, and change the view on all line charts and some bar charts. You can switch between monthly, quarterly, annual, or daily views. To drill up, hover over the chart and click ![]() at the top of the chart. To drill down, click
at the top of the chart. To drill down, click ![]() and then select the desired data point on the chart. To return to the quarterly, monthly, or daily view, click
and then select the desired data point on the chart. To return to the quarterly, monthly, or daily view, click ![]() .
.
The table at the bottom of the page shows the data used to calculate the KPIs of the charts.