Subscription Analytics
Subscription Analytics consolidates and visualizes the most important metrics to track your subscription business. To access subscription analytics, go to the main menu of our Web Admin Tool and click Analytics > Subscriptions.
For a glossary of all subscription-specific terminology, see Subscription Glossary.
Important
You can access the performance analytics and subscription analytics embedded into our web admin tool once you complete the onboarding process successfully. For more information, contact Client Experience.
Tip
Like the Business Intelligence (BI) tool, Performance Analytics and Subscription Analytics provide data to be used as a reference and not for accounting purposes. If you want to generate reports for accounting purposes, use the clearing reports available in the Commerce Assistant. For more information, see Important Information about Business Intelligence Reporting.
Subscription Analytics Overview
The following video presents the new set of functionalities of this feature:
Key Terms
| Key Terms | Description |
|---|---|
| Active Subscribers |
Holders of at least one subscription with a minimum of one paid subscription item ExampleIf a one-item subscription is canceled and it is the only subscription the subscriber has, then one active subscriber is removed from the subscriber count. |
| Active Subscriptions |
Total number of active, paid subscription items at the end of a reported month. An active subscription is any subscription with at least one paid-for subscription item. Active subscriptions can contain an unlimited amount of subscription items and those may vary in quantity. In analytics, this value is impacted by subscription items being added or removed by the subscriber during the customer lifecycle. Active Subscriptions do not include trials. |
| ARPU |
Average monthly recurring revenue across your active subscribers in a given time. The ARPU is the chief indicator of the profitability of your products. |
| ARR |
Yearly representation of the monthly recurring revenue. With a stable customer base, the ARR provides a forecasting measure for future annual income. |
| Churn Rate |
Rate at which subscription items don’t renew compared to the total active subscription items eligible for renewal in a given period. Trial subscriptions are not included. |
| Churned subscriptions |
All of the unrenewed subscription items during a given period. It is a scheduled renewal that did not occur shortly before or by the payment |
| MRR |
Recurring revenue normalized into a monthly amount. Previous and current MRR provide a forecasting measure for future income and overall growth rate. |
| Net Revenue |
Amount of revenue generated by subscribers based on the exchange rate at the time of the transaction. All discounts and shipping costs are subtracted from the net revenue, while Cleverbridge fees and affiliate |
| New Subscriptions |
Active and paid subscription items with the first payment having occurred in the selected period. In analytics, this value corresponds to the count of the initial billing interval for paid-for subscription items which is equivalent to 0. |
| Fixed-term Churn | Occurs when the expiration date for the subscription item is prearranged after a specified contract period. This means that the subscription item has a rigid expiration date, or there may be unique circumstances leading to its termination, such as compliance regulations or the discontinuation of the product. The reasons for fixed-term churn are the following: External Reason, Limited Renewals, and Bounced Mail. |
| Renewal Rate |
Rate at which subscription items renew out of the total subscription items eligible for renewal in a given period. Grace period is considered, and trial subscriptions are not included. |
| Renewed subscriptions |
Paid subscription items for the purpose of extending the access to a product or a service beyond the initial purchase |
| Subscription Interval |
A subscription interval is a period after which a recurring purchase is renewed and billed. |
| Subscription Item |
A component of a subscription with its own set of attributes, including price, description, quantity, and feature set. A subscription item can be a recurring product or service that you offer your customers. ExampleIf the subscriber purchases two of your subscription products in a single transaction and both those products have an identical interval length, this transaction translates into one subscription, and a single invoice is issued to the customer. All items are grouped under a unique subscription ID, however they can have different item statuses. |
| Subscription Items Churn Cohort |
The Subscription Items Churn Cohort calculates the churn rate of subscription items over various subscription intervals in a given period. Cohort groups a set of subscription items by the time of their sign-up, the unifying factor being the month of the sign-up. Grace period is considered, and trial subscription items are not included in the calculation. |
| Voluntary Churn |
Occurs when a subscriber purposefully decides to discontinue the use of a subscription item. The reasons for voluntary churn are the following: Customer Cancellation, Manual Subscription, Refund, and Chargeback |
| Involuntary Churn | Occurs when the payment for the subscription item is not received by the renewal date for an unavoidable reason often related to outdated payment information, failed account connection, insufficient funds, or unsuccessful Offline Payment |
| X-Parameter |
The X-Parameter Class filter allows you to display and apply the x-parameters under the x-parameter class to the metrics. You can have a maximum of 5 x-parameter classes under which the various x-parameters are grouped. |
| X-Parameter | X-Parameters group the revenue and subscriptions in hierarchical classes. You can have up to 10 hierarchical x-parameters under each x-parameter class. |
Subscription Analytics Pages
Subscription Analytics offers the following pages to help you analyze your subscription business:
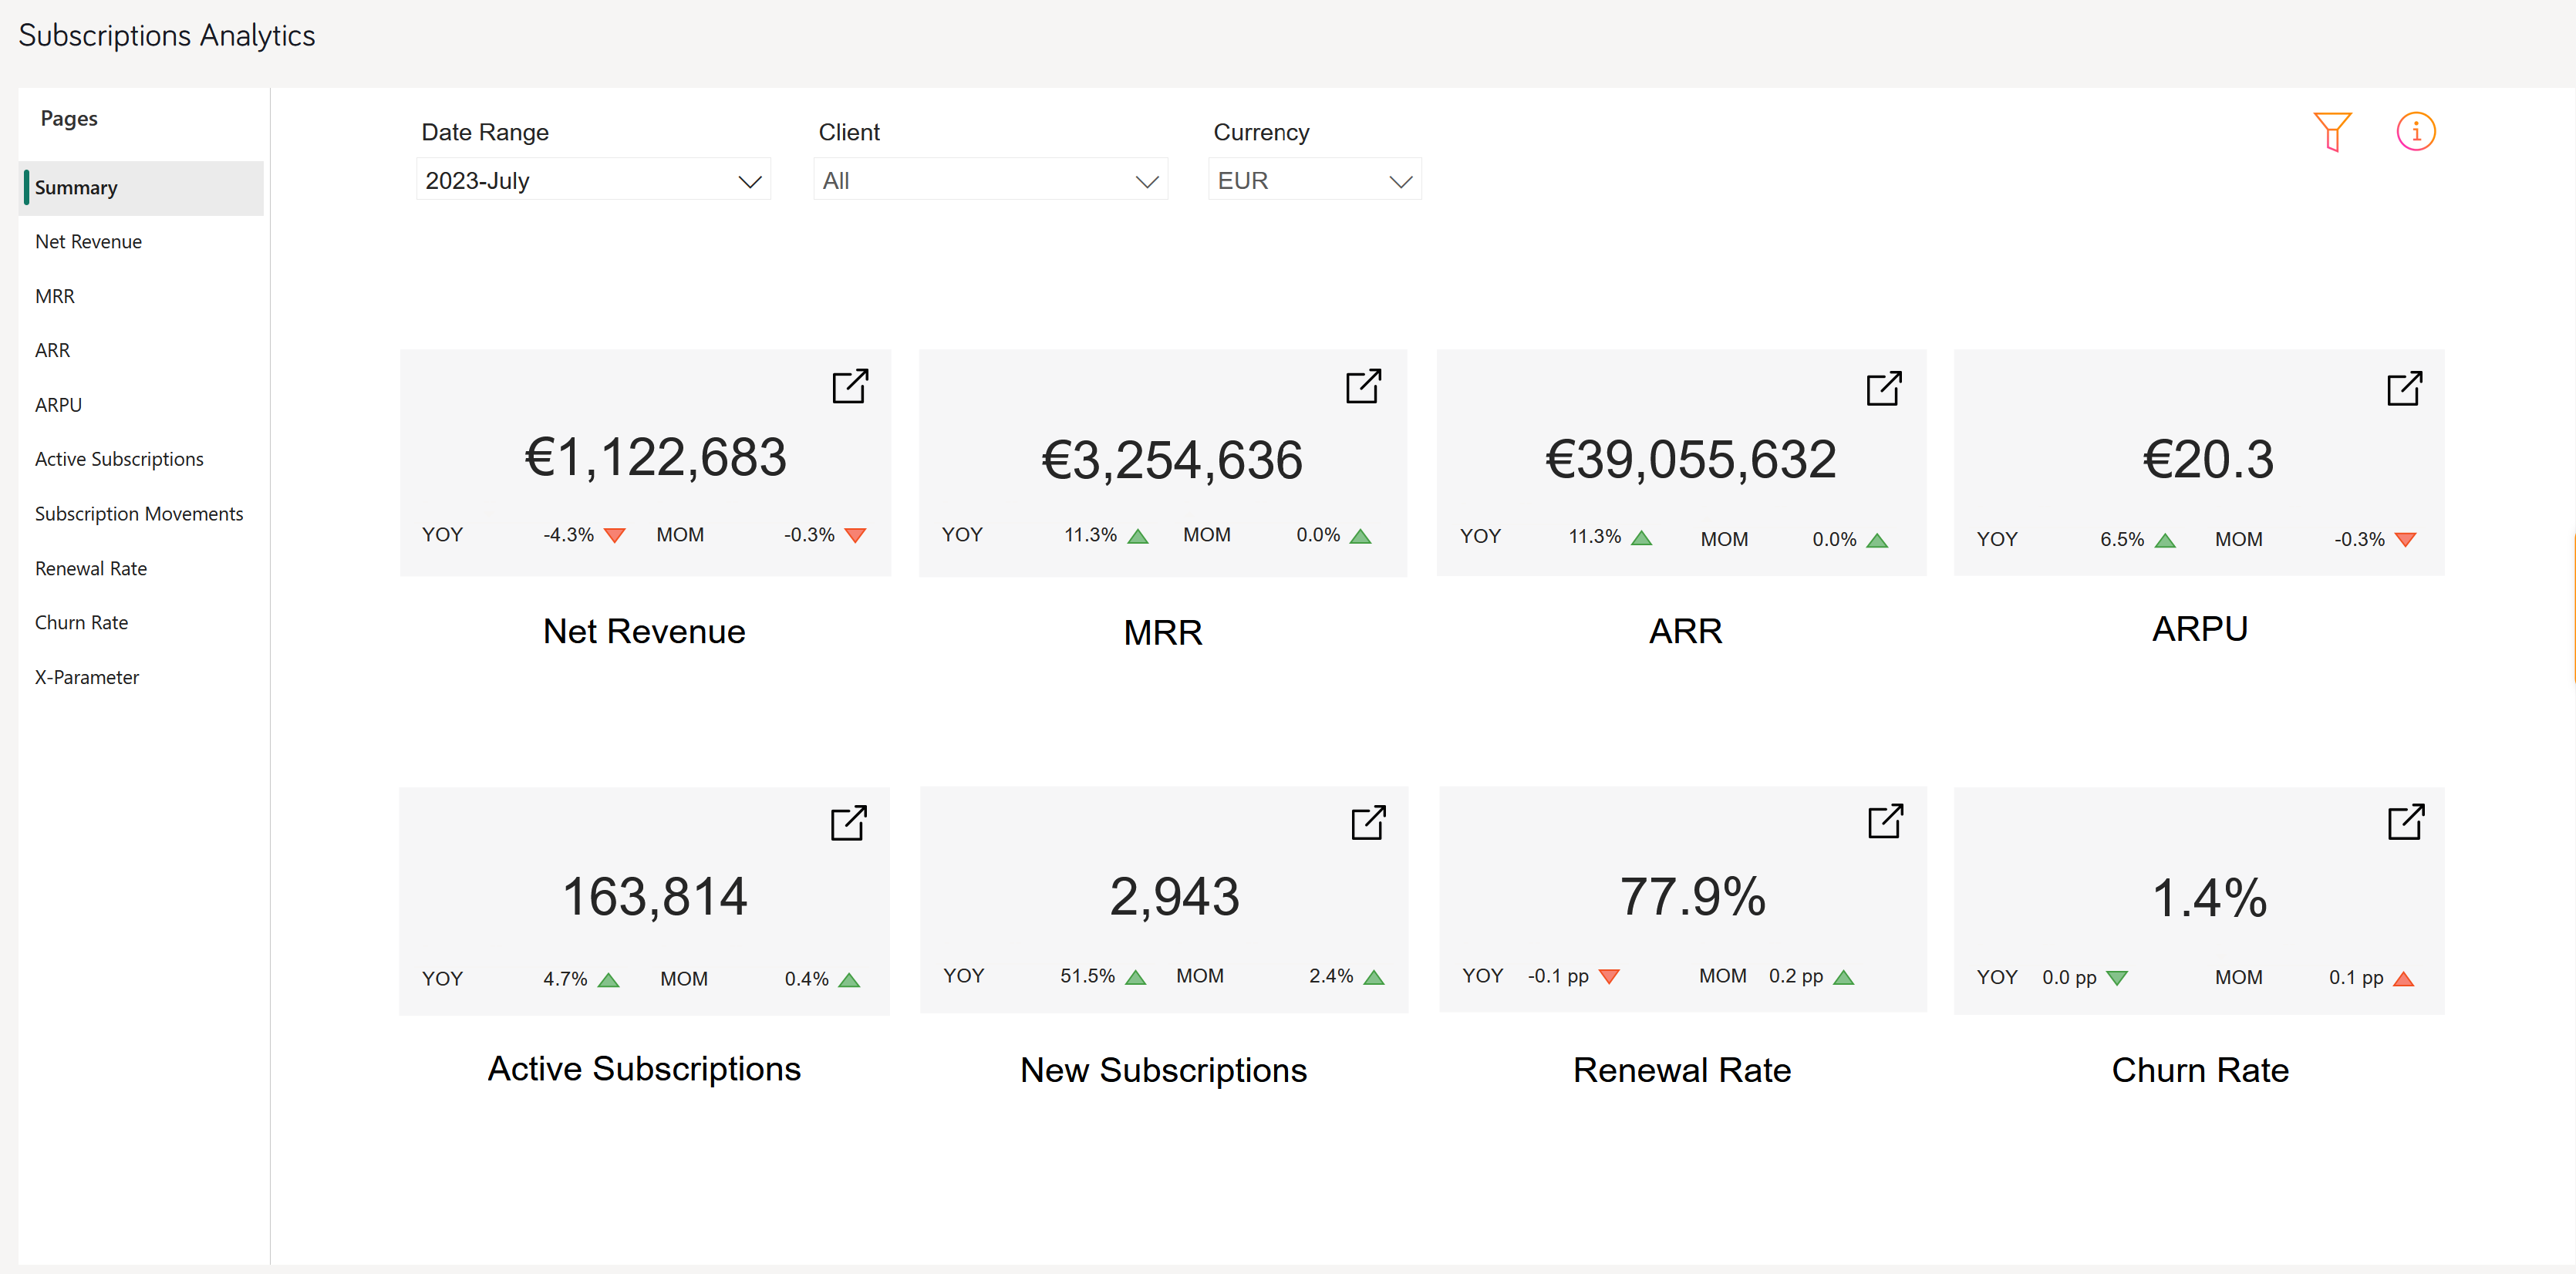
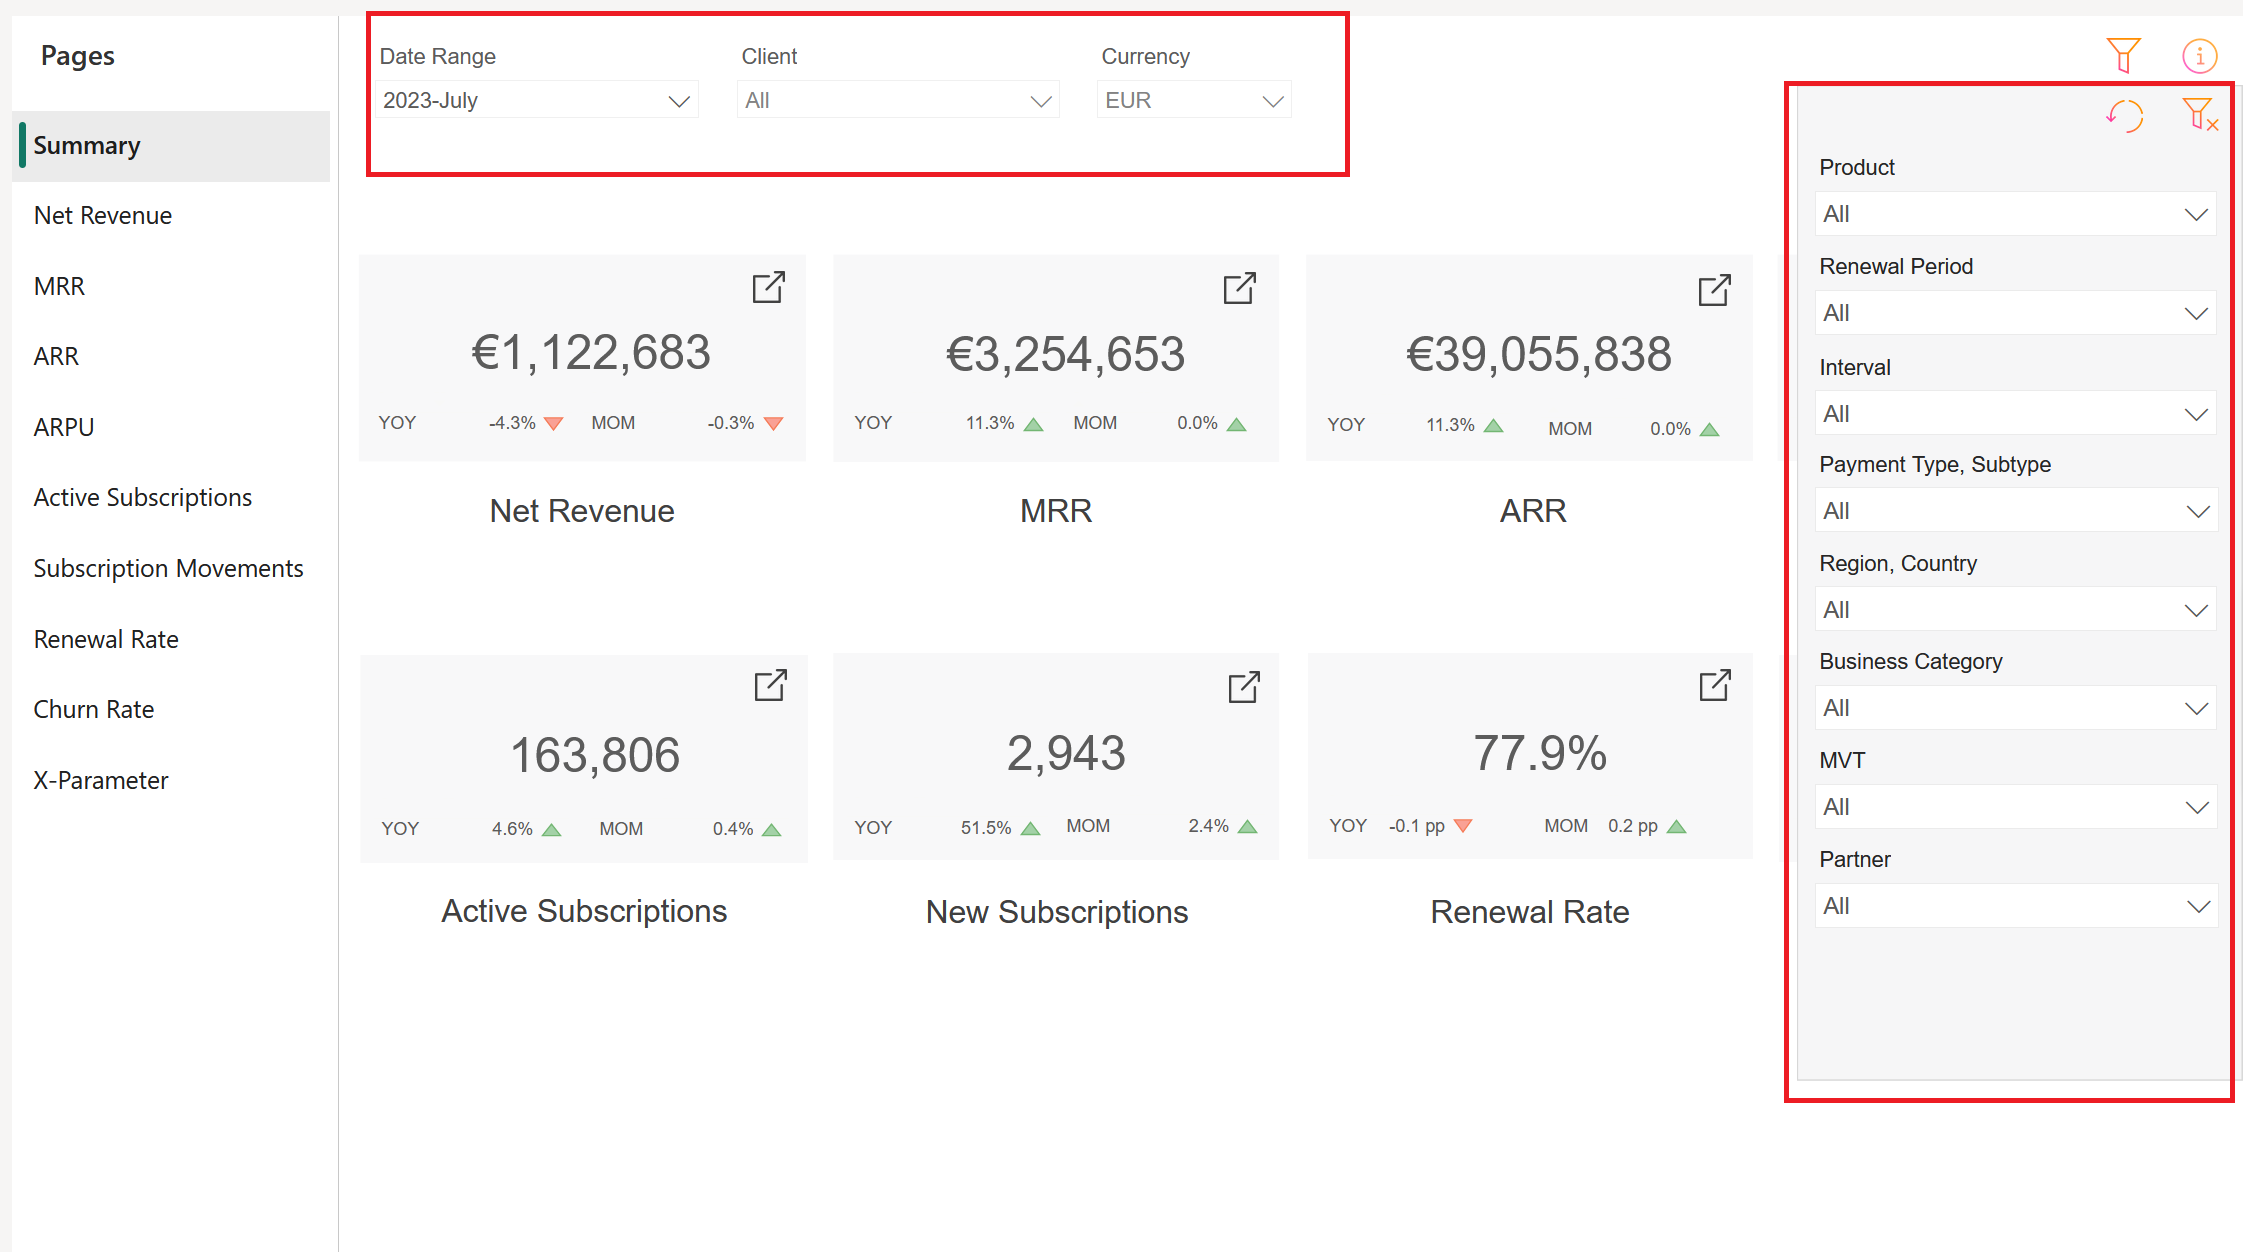
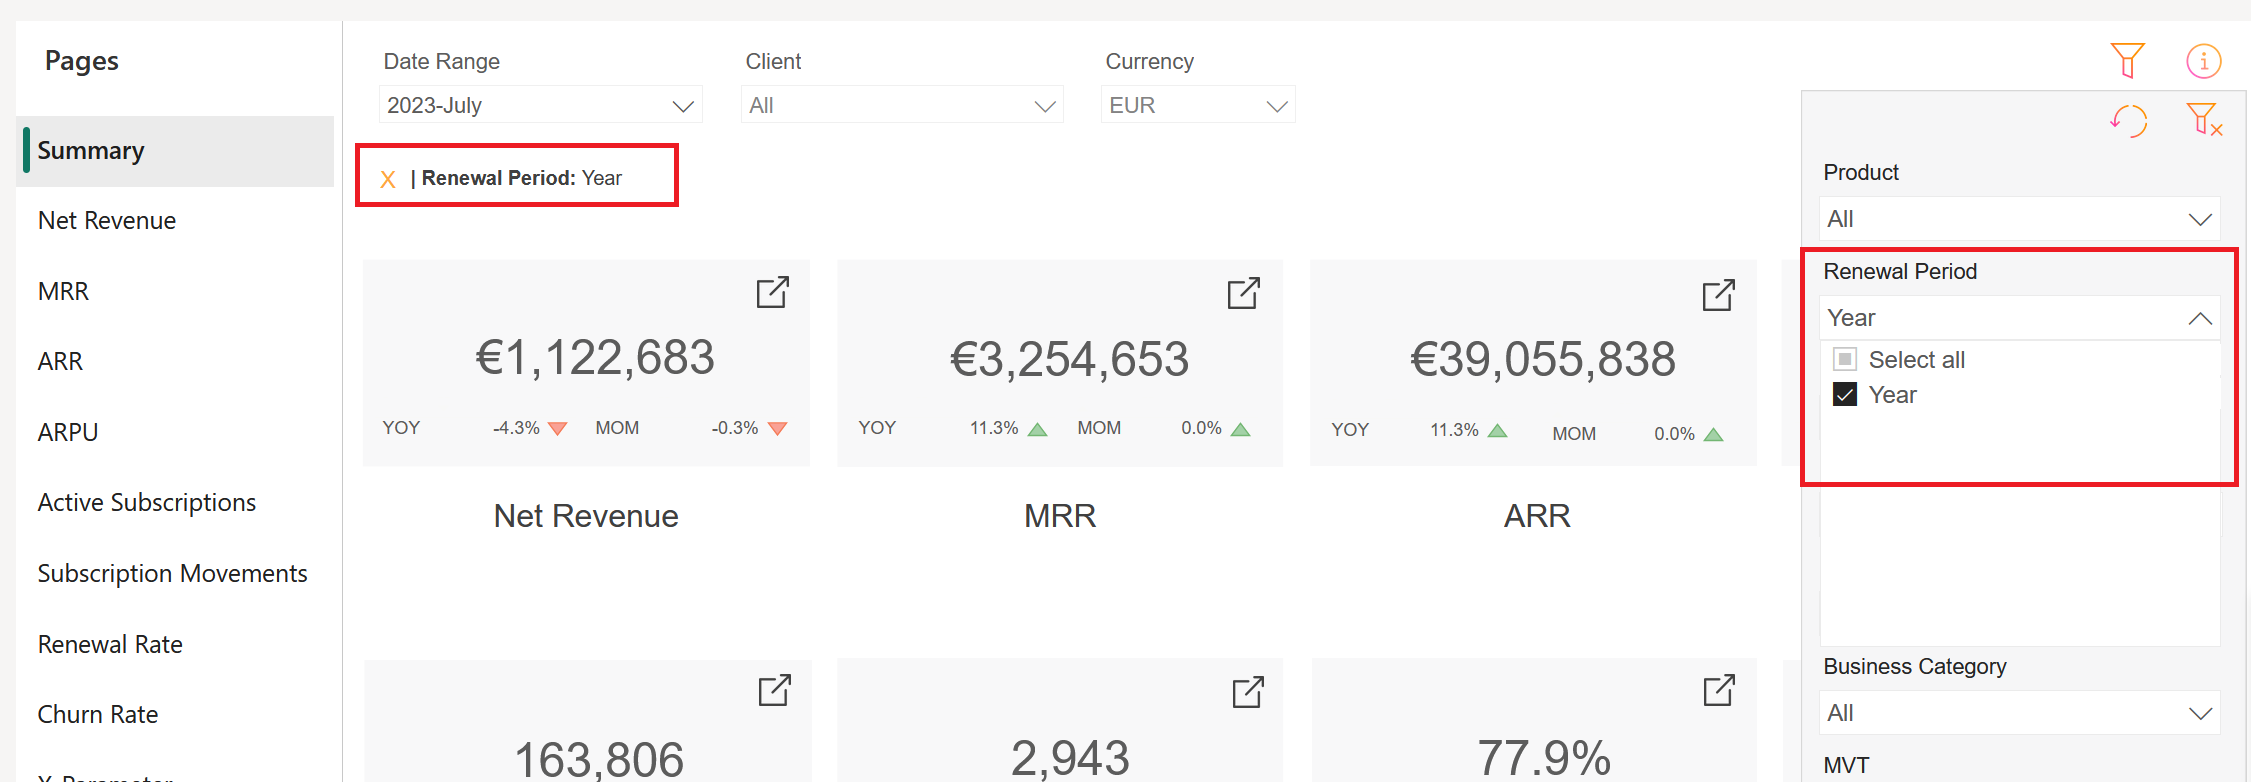
The Summary is an at-a-glance view of the most important KPIs of your subscription business in the selected month.
On the following screenshot, the menu items in the left-hand side navigation bar coincide with the respective tile, which means that each tile you click leads you to the corresponding report in the navigation bar. The additional tile Net Revenue leads to the Monthly Net Revenue chart.
By clicking on ![]() in the top right corner you will see a list of filters you can apply to the report. For descriptions, see Filters.
in the top right corner you will see a list of filters you can apply to the report. For descriptions, see Filters.
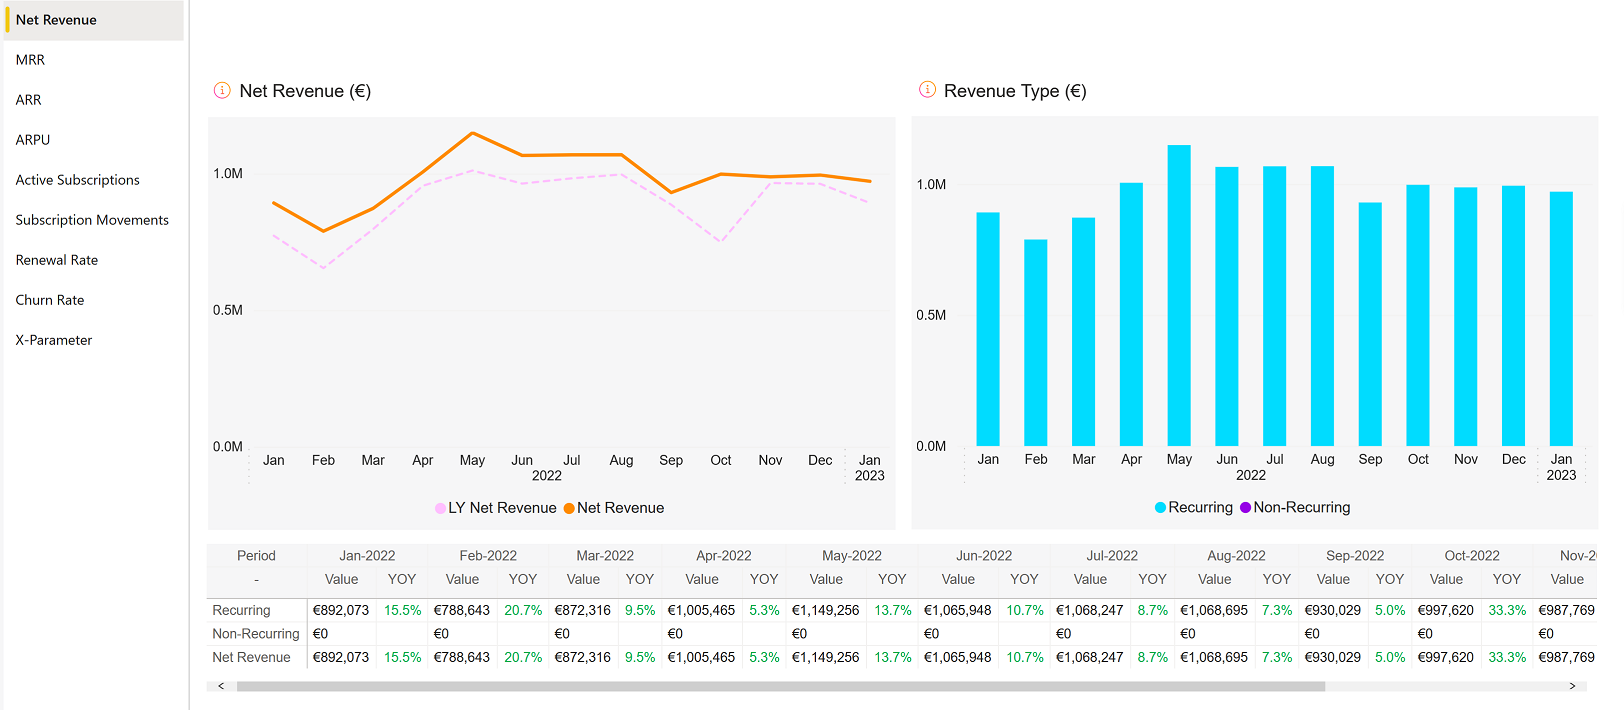
Net Revenue shows the net revenue that subscribers paid to Cleverbridge (based on the exchange rate at the time of transaction). This calculation subtracts any discounts or shipping costs. Cleverbridge fees and affiliate commissions are included.
The Net Revenue chart shows the following data:
- Net Revenue: selected period
- LY Net Revenue: Net Revenue last year in the same period
The Revenue Type chart shows the following data:
- Recurring: net revenue generated by subscription purchases
- Non-Recurring: net revenue generated by one-time purchases
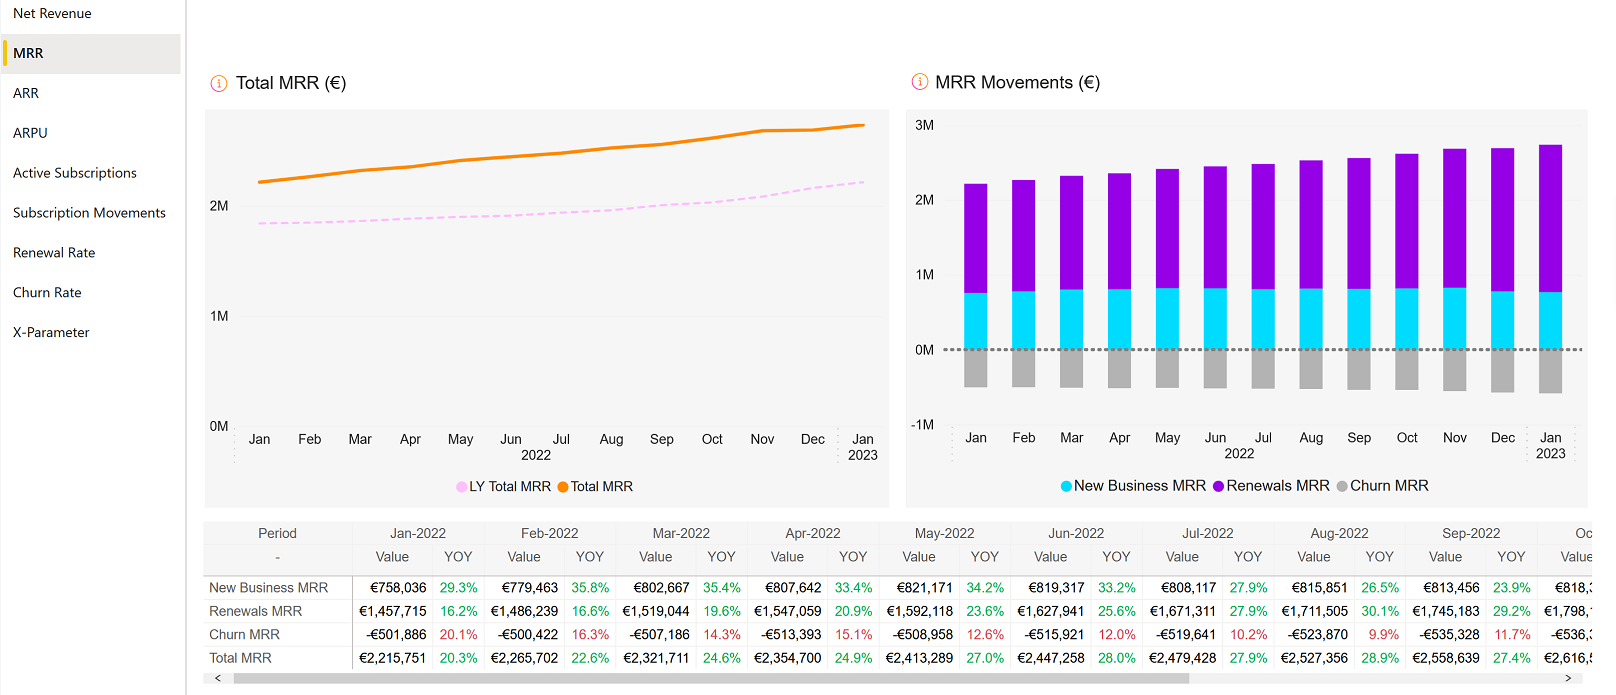
Total MRR shows your recurring revenue normalized into a monthly amount. MRR is important for analyzing business growth on a short-term basis, as a lot of subscriptions may have an annual renewal policy and seasonal dependencies, and a skewed distribution can significantly impact the analysis of dynamics in a shorter period.
The Total MRR line chart shows the following data:
- Total MRR: Total MRR of the selected period
- LY Total MRR: MRR last year in the same period
The MRR Movements chart shows the share of MRR generated by new and renewed subscription items in a period:
- New Business MRR: MRR generated by new subscription items in a period
- Renewals MRR : MRR generated by renewed subscription items in a period
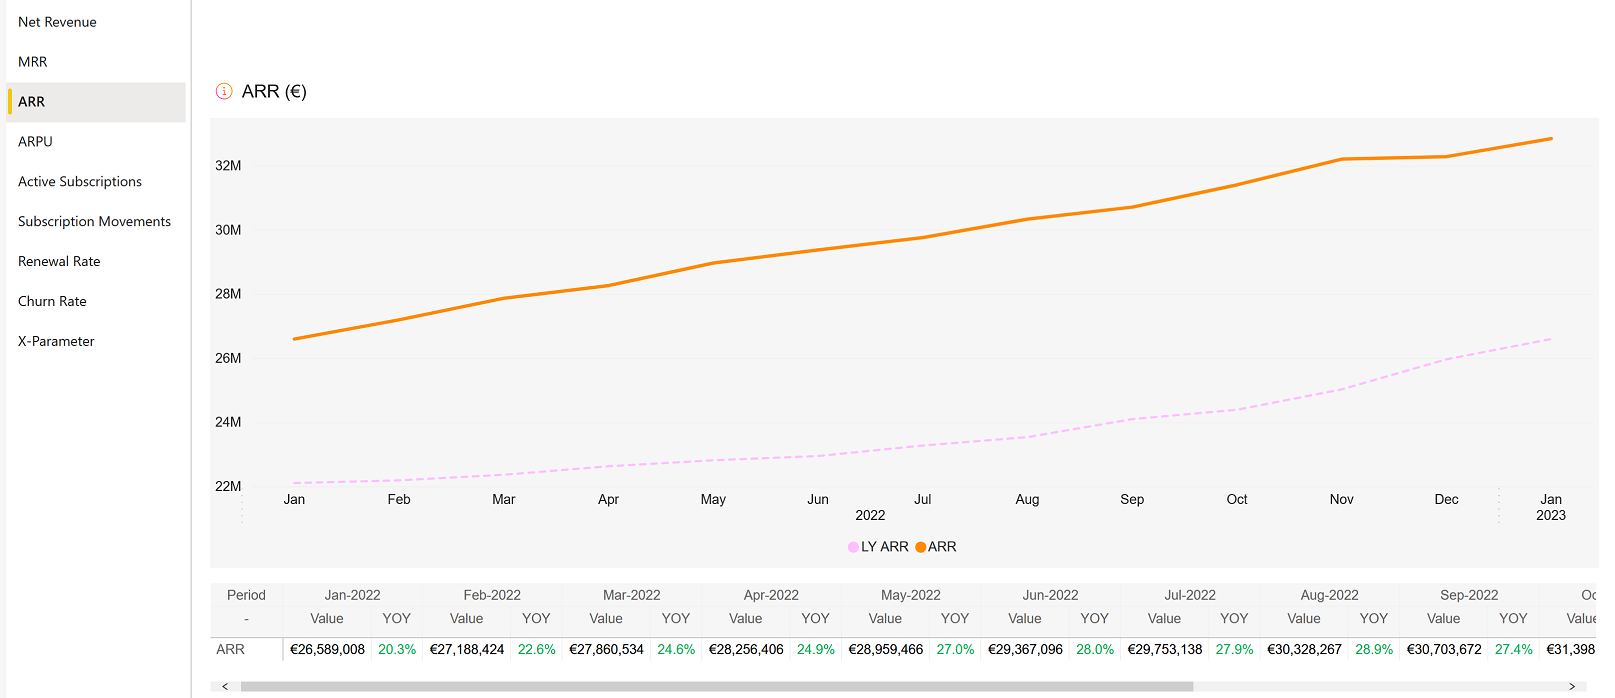
Annual Recurring Revenue (ARR) is a yearly representation of MRR. ARR helps project future revenue for the year based on your current monthly revenue.
The ARR chart shows the following data:
- ARR: Total ARR of the selected period
- LY ARR: ARR last year in the same period
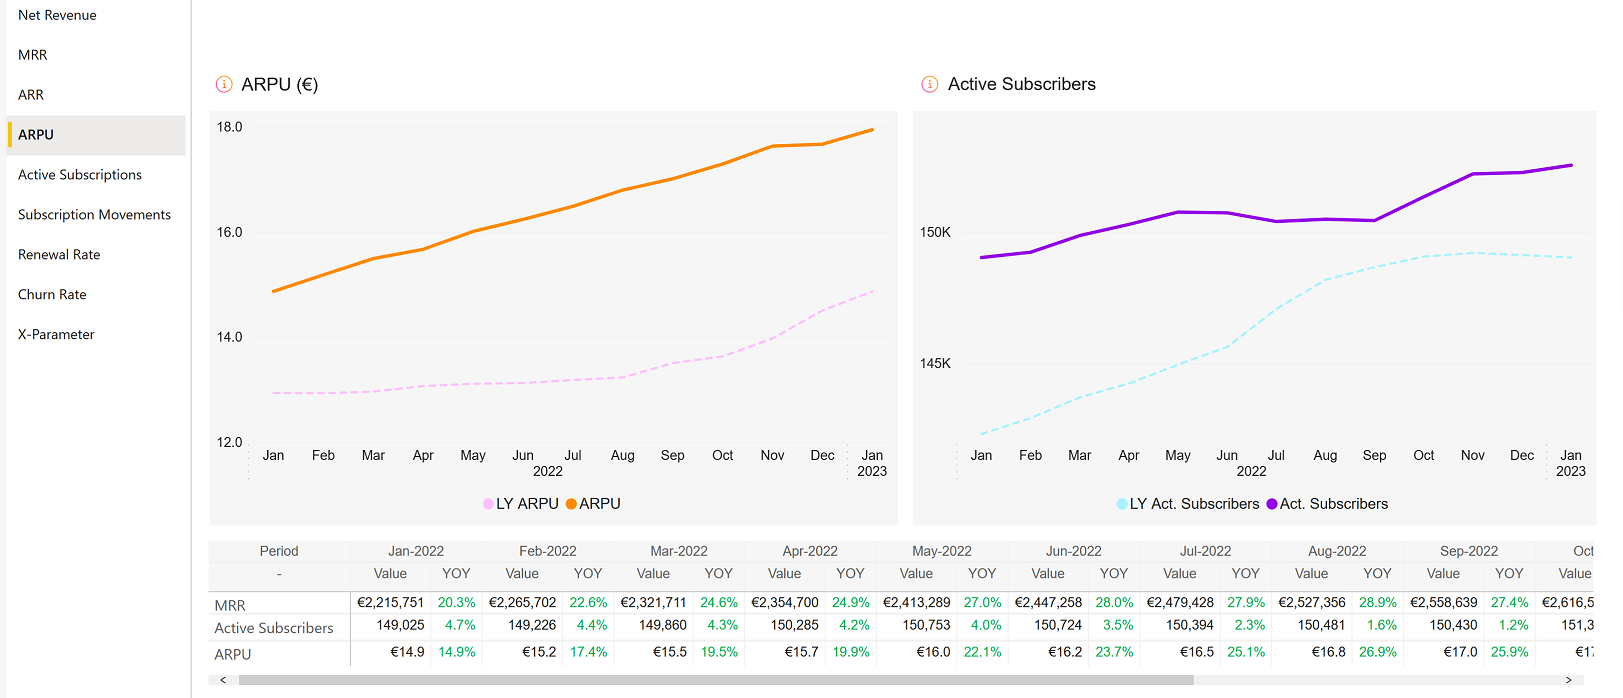
ARPU (Average Revenue per User) shows average revenue generated by one subscriber in a period. ARPU is calculated as MRR divided by active subscribers.
The ARPU line chart shows the following data:
- ARPU: ARPU of the selected period
- LY ARPU: ARPU last year in the same period
The Active Subscribers line chart shows the following data:
- Act. Subscribers: Active subsribers of the selected period
- LY Act. Subscribers: Active subscribers last year in the same period
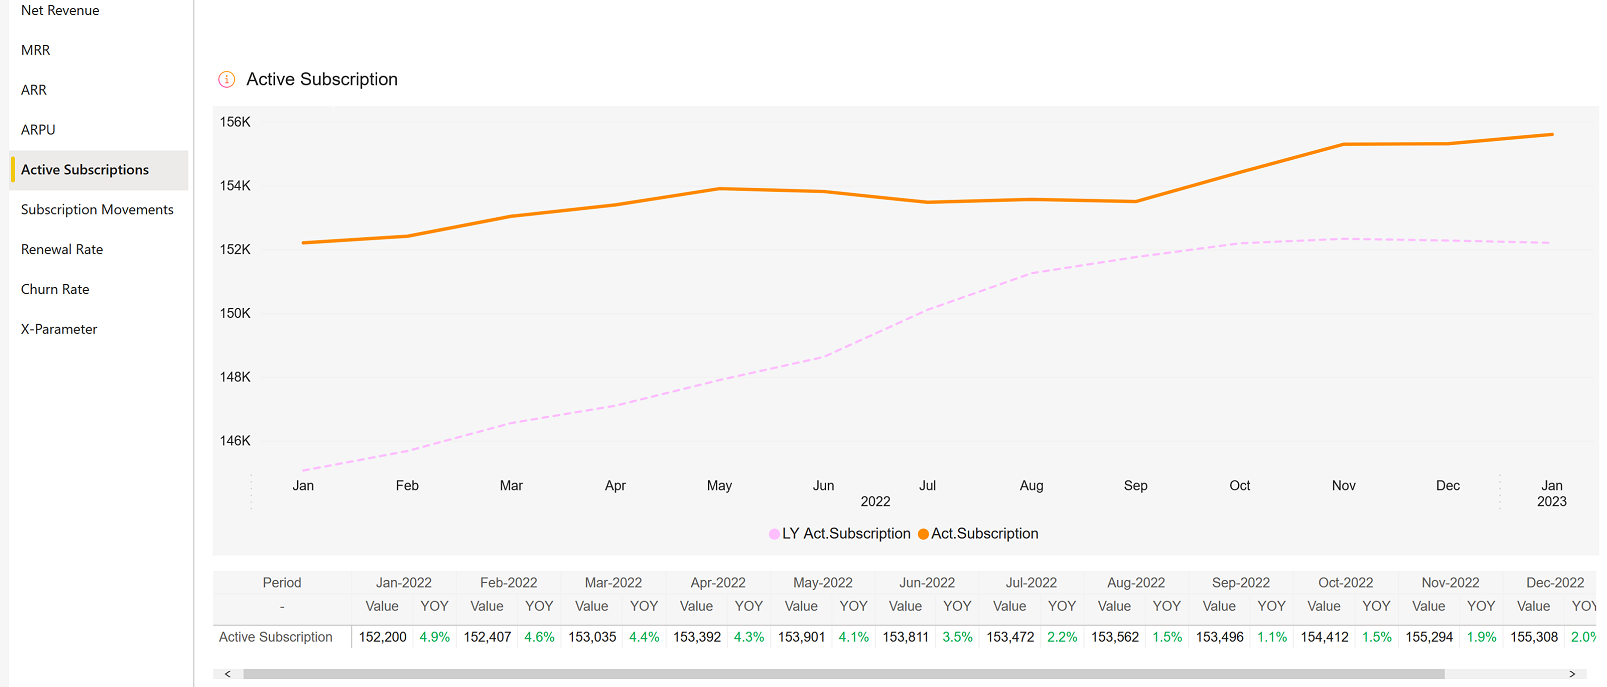
Active Subscriptions display the total number of active, paid subscription items at the end of a reported month. A subscription item is a recurring product within the subscription that is billed at regular intervals, such as monthly or yearly.
The Active Subscriptions chart shows the following data:
- Active Subscriptions: Active Subscriptions of the selected period
- LY Active Subscriptions: Active Subscriptions that occurred last year in the same period
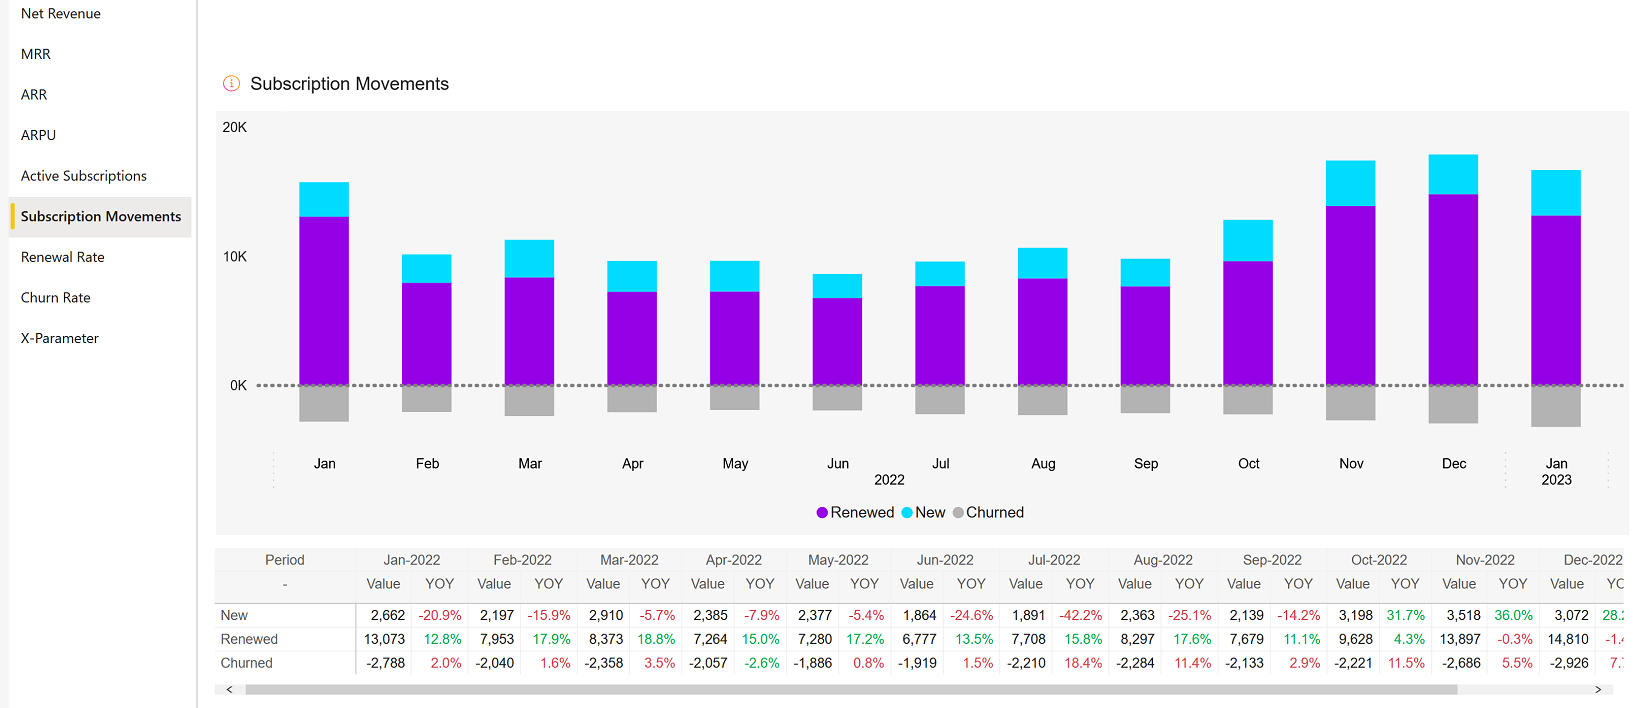
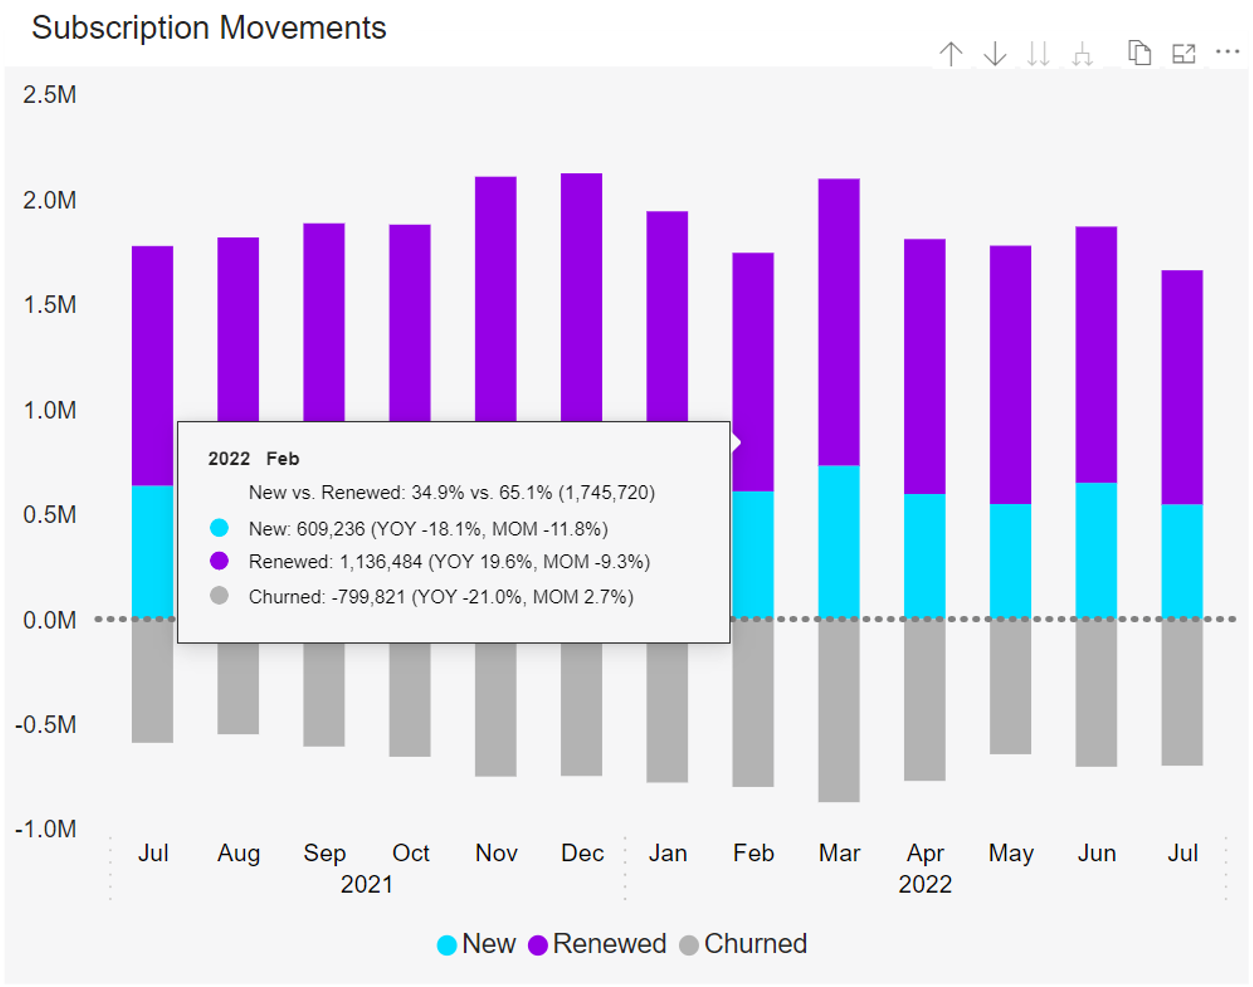
The Subscriptions Movements bar chart displays the changes in the number of subscription items over a certain period of time, specifically showing the growth or decline in the number of new subscription items. The chart displays the following metrics:
- New: active, paid subscription items with the first payment having occurred in a period
- Renewed: subscription items, which were paid to extend the access to a product or a service beyond the initial purchase. This value corresponds to the count of distinct subscription items where subscription interval > 0.
- Churned: subscription items that have not been renewed in a given period of time. In other words, it is a scheduled renewal that did not occur on or before the expected payment date, which results in the loss of an existing subscription item.
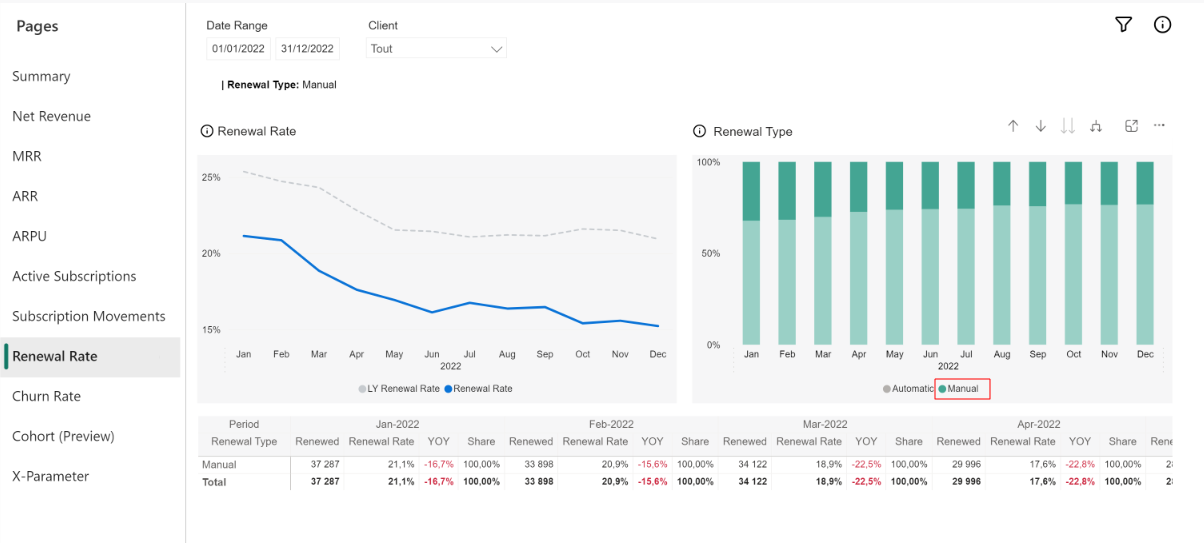
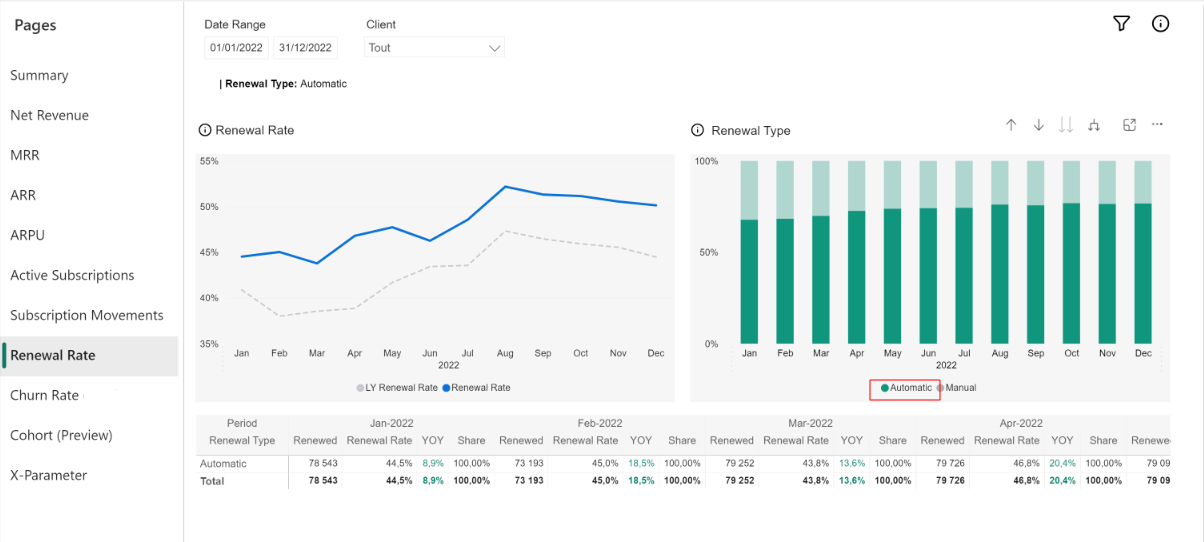
Renewal rate shows the percentage of subscription items that have been renewed from the total number of items eligible for renewal in a given period. Grace period is considered, and trial subscriptions are not included. The chart shows the following data:
- Renewal Rate: Renewal rate for the selected period
- LY Renewal Rate: Renewal Rate last year in the same period
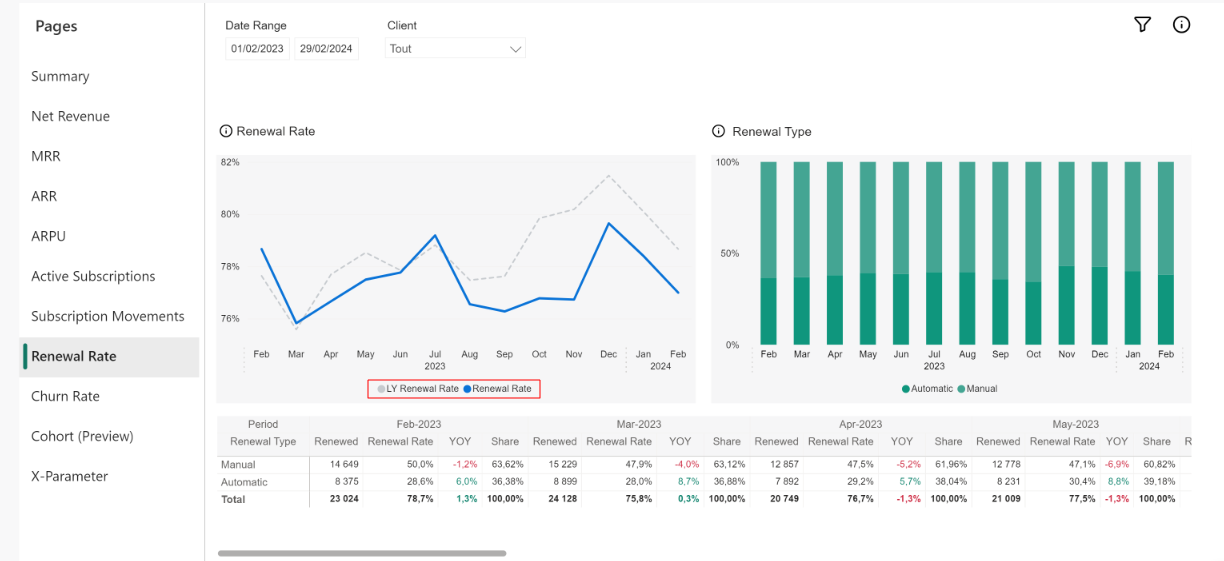
Renewal Type classifies subscription renewals based on the type of subscription management model you’ve adopted: Version 1.0 or Version 2.0. Each version is characterized by distinct functionalities. For more information on renewal types, see Subscription Management 1.0 and 2.0.
Note
To streamline the customer experience for both automatic and manual subscriptions, payment reminders are automatically sent as the renewal process approaches, regardless of the chosen subscription type or payment option![]() Set of payment choices displayed to the customer on the checkout page. Available payment options are based on the customer's GeoIP location and include different payment methods and types, for example: a Purchase order (PO) is a payment option we offer our B2B customers. POs are usually paid via the payment method of wire transfer..
Set of payment choices displayed to the customer on the checkout page. Available payment options are based on the customer's GeoIP location and include different payment methods and types, for example: a Purchase order (PO) is a payment option we offer our B2B customers. POs are usually paid via the payment method of wire transfer..
There are two types of renewal:
- Automatic Renewal is the default renewal type within the Cleverbridge platform. With this type, subscriptions are seamlessly renewed at the end of each billing interval. Automatic subscriptions simplify the renewal process for customers and ensure uninterrupted service without the need for manual intervention. Customer involvement is only required if a change, such as an upgrade, downgrade, or cancellation, is requested.

- Manual Renewal is designed for customers who seek greater autonomy in managing their subscription. This type mandates customer consent for each renewal and offers more flexibility to adjust subscription details as necessary. Manual renewal is reversible, which means customers have the option to switch between manual and automatic renewal based on their preference.

Note
If you’re managing your subscriptions using Subscription Management 1.0 on the Cleverbridge platform, subscription renewals are categorized as follows: Automatic Renewal applies to subscriptions with statuses like: Active, Hold, Grace, New. Subscriptions not falling into these categories, such as refunded subscriptions or those affected by a chargeback, are classified under Manual Renewal. For more information on subscriptions and their statuses, see Subscription Statuses and Update Options > Subscription Statuses.
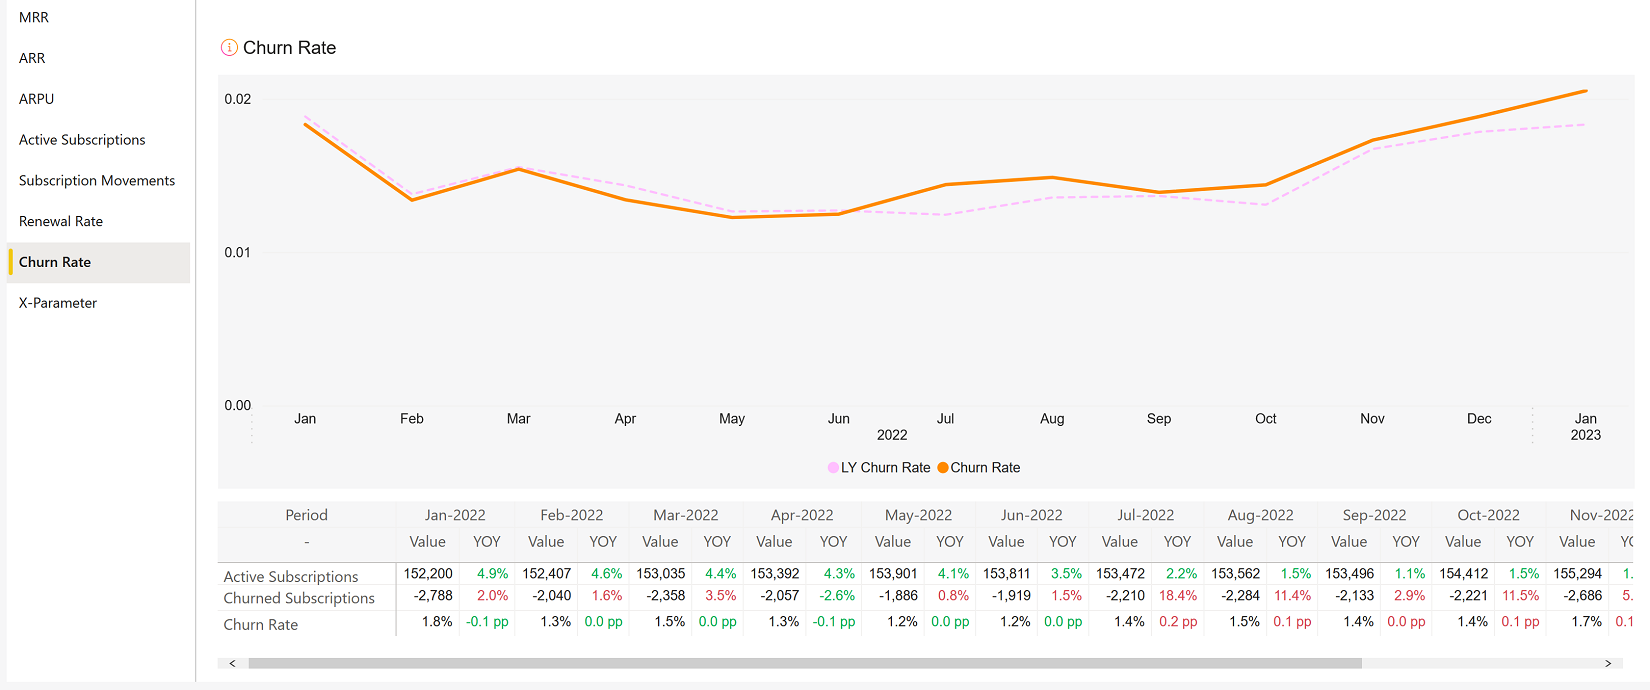
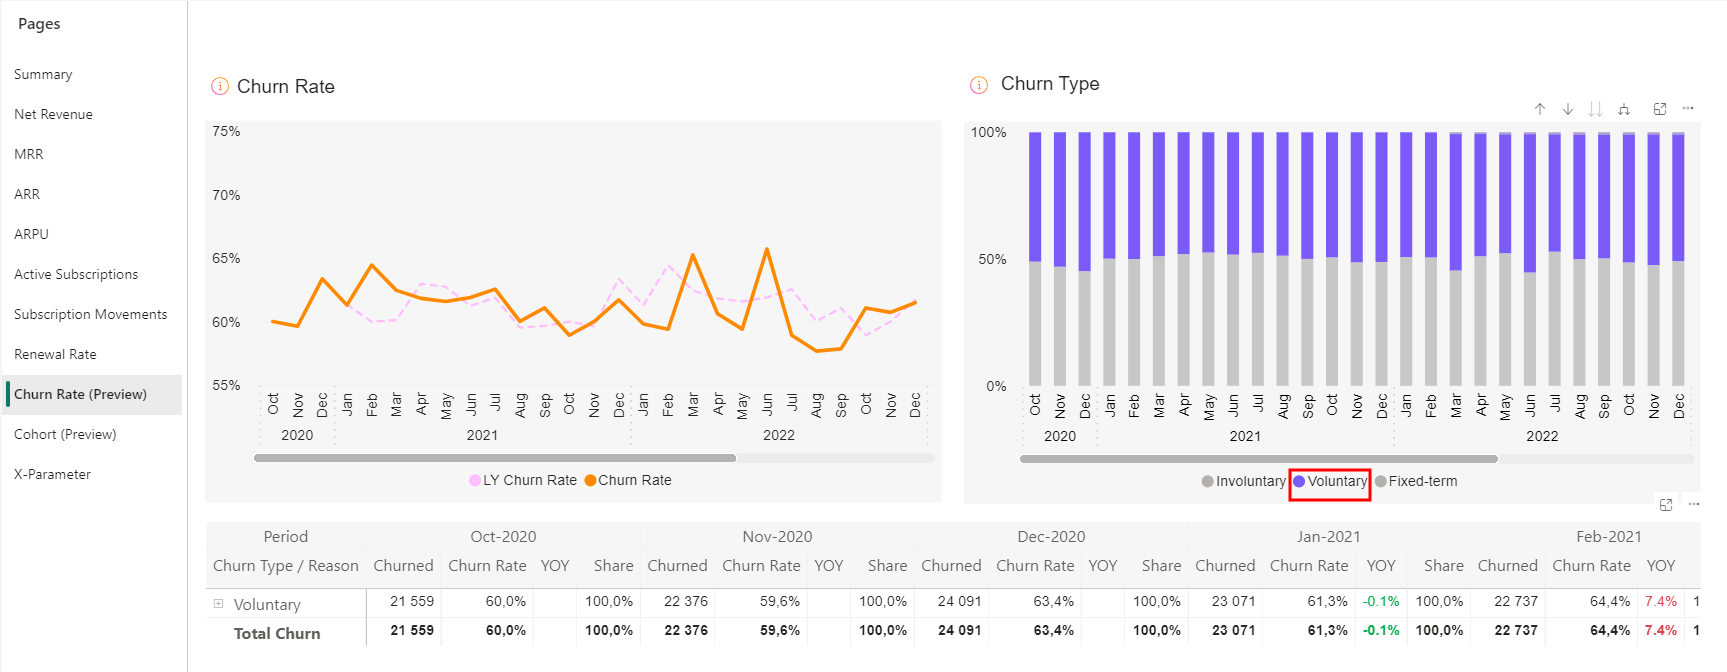
Churn Rate shows the percentage of subscription items that have not been renewed from the active subscription items in a given period. Grace period is considered, and trial subscription items are not included.
- Churn Rate: Churn Rate of the selected period
- LY Churn Rate: Churn Rate last year in the same period
Churn Type categorizes the churn of subscribers and provides insights behind customer attrition. Whether voluntary, involuntary, or fixed-term, the underlying reasons for each churn type can be identified, tracked, and investigated for improved customer success. The churn data reflects subscription renewals that already occurred.
There are four types of churn:
- Voluntary Churn occurs when a subscriber purposefully cancels a subscription item. The reasons for voluntary churn are the following:
- Customer Cancellation: The customer opted out of renewing the subscription item before or during the renewal process.
- Manual Subscription: The customer did not give their consent to renew the subscription item after the grace period reached its end. For more information on subscription renewal types, see Subscription Life Cycle Events.
- Refund: The customer requested a refund right after the successful renewal process of the subscription.
- Chargeback: The customer didn’t recognize the transaction on their bank statement right after the successful renewal process of an automatic subscription. They requested reimbursement from their bank thereafter.
- Involuntary Churn occurs when the renewal payment for a subscription item is not received by the renewal date for one of the following reasons:
- Outdated Payment Information
- Failed Account Connection
- Insufficient Funds
- Offline Payment: During the renewal process, the transaction using an offline payment method wasn't successfully processed.
- Fixed-term Churn occurs when a subscription item has a hard-set expiration date. This means that the subscription item will automatically be canceled at the end of a contract period because of special circumstances like discontinuing a product or seizing business altogether with an embargoed country. The reasons for fixed-term churn are the following:
- External Reason: The subscription item churns out due to external reasons such as export regulations and compliance, discontinued product, terminated client ID, or API call with flag to terminate.
- Limited Renewals: The subscription item churns out after a predetermined number of renewals.
- Bounced Mail: The subscription item churns out following an undelivered email to the customer and high risk of chargeback is suspected.
- Churn handled by Client occurs when clients independently manage subscriptions, which is executed via API call by using the Deactivate Subscription Items endpoint.
Note
The renewal type is independent of the payment method![]() Describes the actual payment method used by the customer to complete the purchase, for example, Visa, wire transfer, or SEPA Direct Debit. selected by the customer. If an item churns while being renewed manually and paid for by an offline payment method simultaneously, the registered churn reason for the item churn is manual subscription.
Describes the actual payment method used by the customer to complete the purchase, for example, Visa, wire transfer, or SEPA Direct Debit. selected by the customer. If an item churns while being renewed manually and paid for by an offline payment method simultaneously, the registered churn reason for the item churn is manual subscription.
Note
The manual subscription churn reason outranks offline payment. This means that if an item churns while being paid for by an offline payment and the subscription is renewed manually by the customer, the reason for the item churn is manual subscription and not offline payment.
Churn cohort is a powerful feature for subscription businesses to understand user behavior, to measure user retention/churn, and get insights into customer lifetime value (CLV). Subscription items are grouped into cohorts based on an interval basis (month or year) at the moment of sign-up. Consequently, the churn rate is calculated for each upcoming subscription interval respectively.
The Subscription Items Churn Cohort calculates the churn rate of subscription items over various subscription intervals in a given period. Cohort groups a set of subscription items by the time of their sign-up, the unifying factor being the month of the sign-up. Grace period is considered, and trial subscription items are not included in the calculation.
The subscription item has churned out when the billing date is overdue and the subscription item hasn't been renewed.
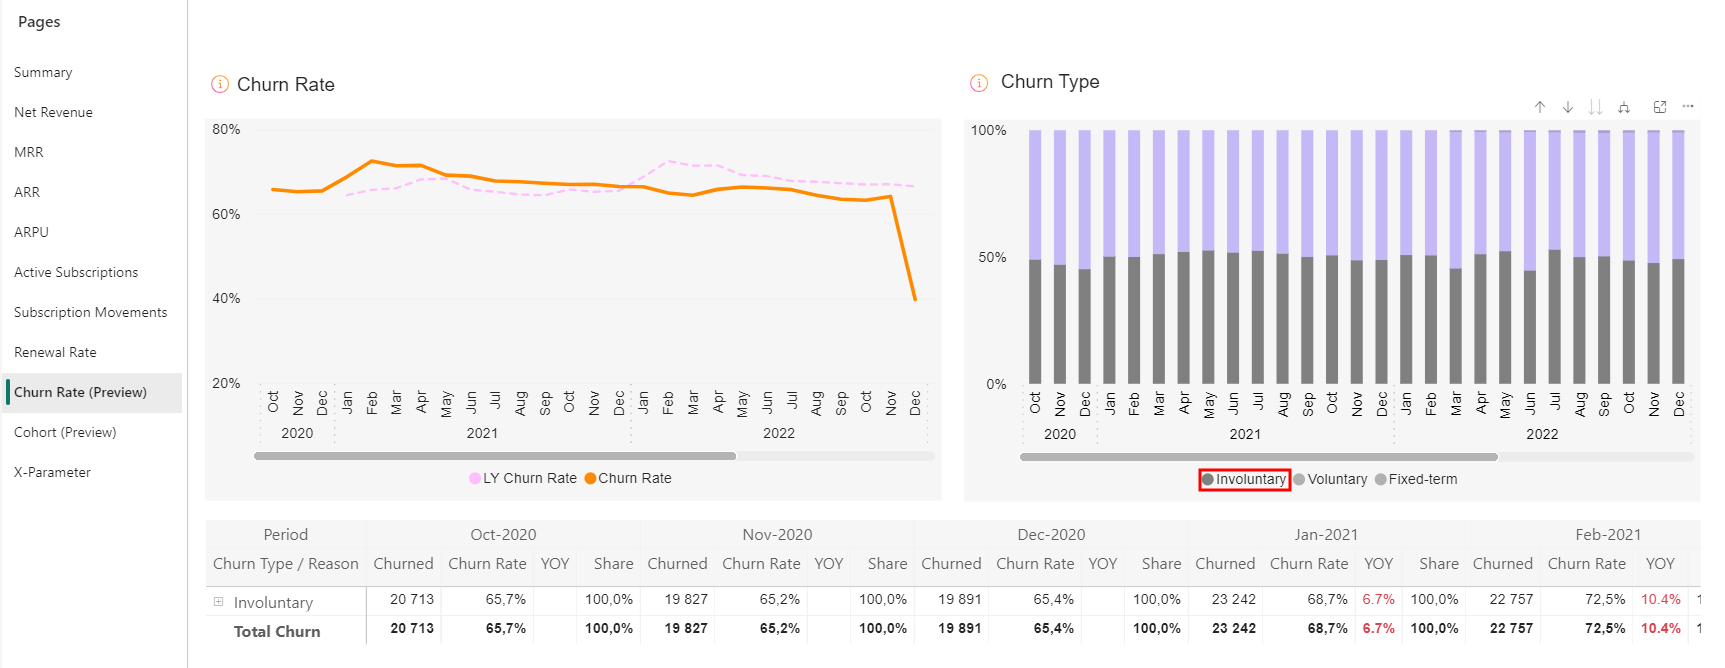
The % of Total table shows the following data:
- In the rate % view: the percentage of subscription items that churned out in each interval. The total number of subscription items from the New column makes the 100%. See the example below for more details.
- In the count # view: the total number of subscription items that churned out in each interval, see the example below for more details.
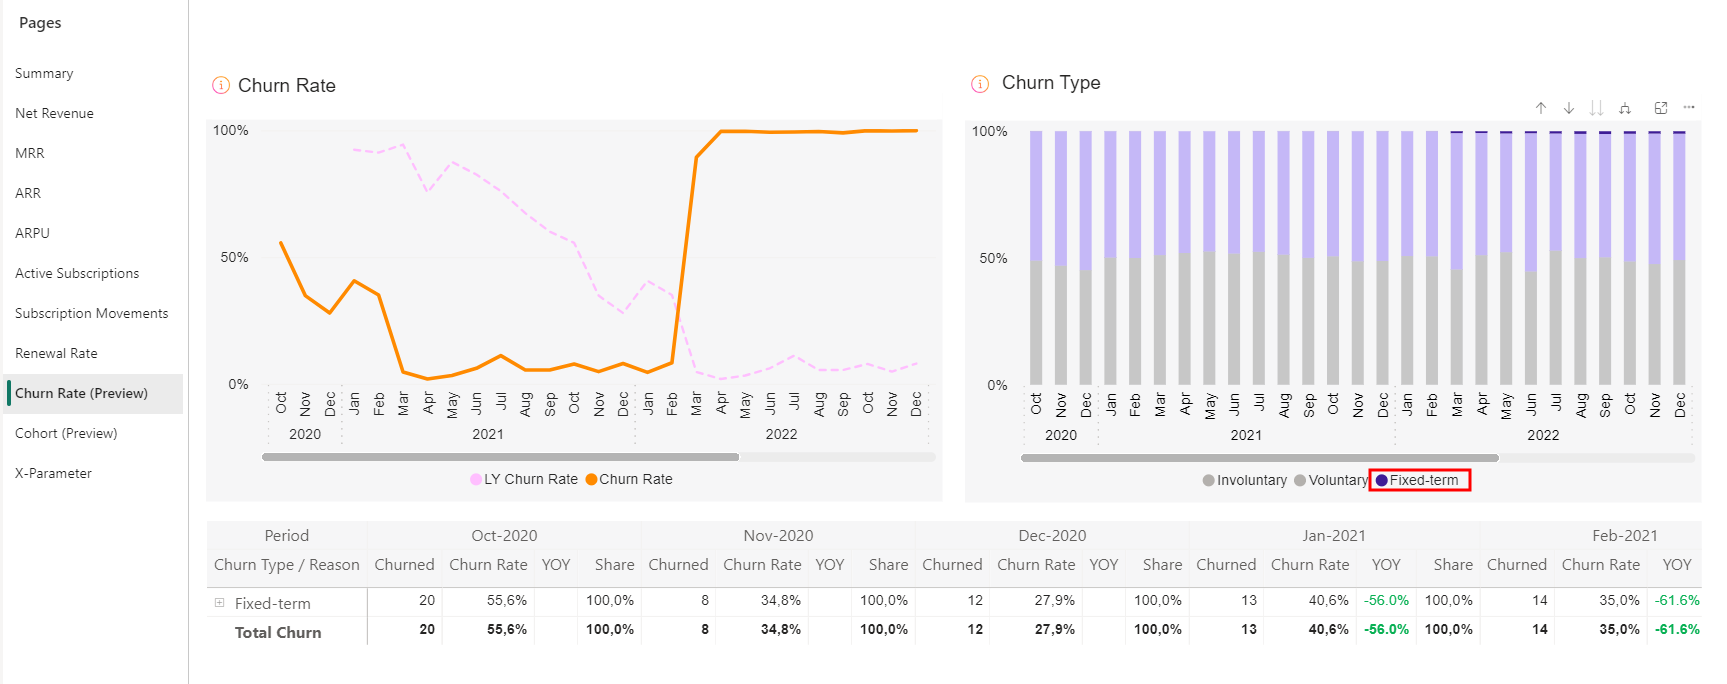
The Cumulative table shows the following data:
- In the rate % view: the percentage of subscription items that churned out in all previous and current intervals. The total number of subscription items from the New column makes the 100%. See the example below for more details.
- In the count # view: the sum of subscription items that churned out in all previous and current intervals, see the example below for more details.
Example
In July 2022, a client sold 1028 subscription items that are billed yearly.
Image 1 shows that from the cohort of yearly billed subscription items for which customers signed up in July 2022, 48.4% churned out at the first interval; another 12.2% churned out at the second interval; and a further 6.4% churned out at the third interval. The cohort analysis of this example shows the customers become more loyal with time.
The same data expressed in real numbers, not in percentage, is shown on the total count view.
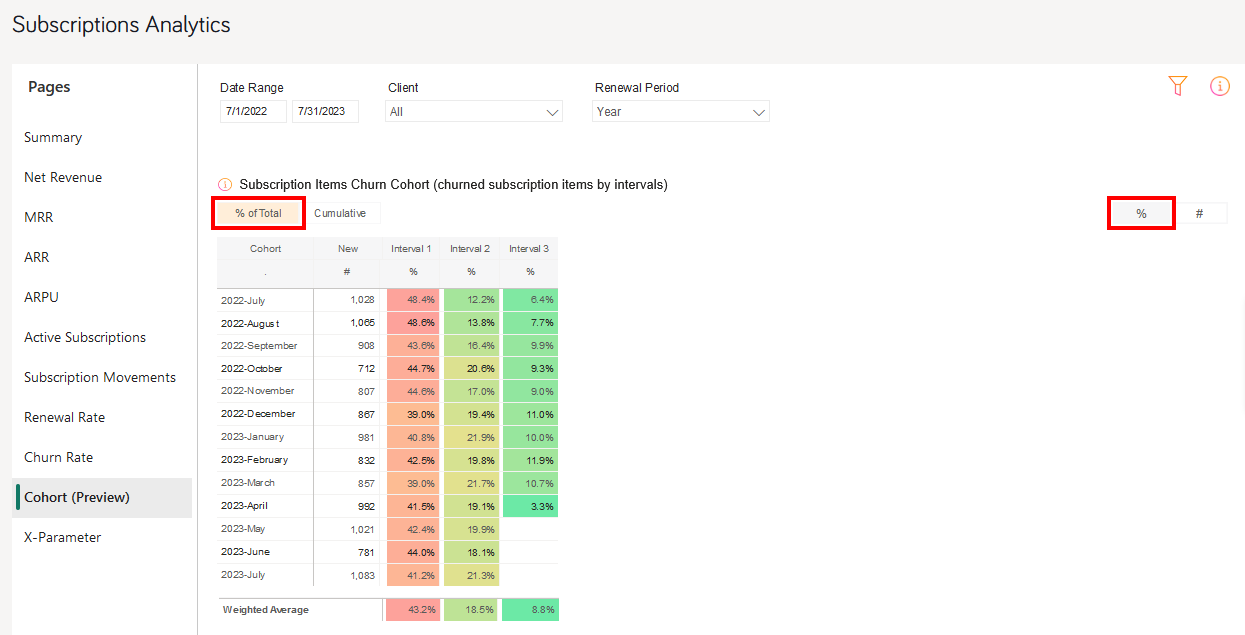 Image 1 - total percentage view
Image 2 shows the cumulative percentage view: at the first interval, 48.8% of subscription items sold in July 2022 churned out; then, at the second interval, 48.4% + 12.2% = 60.6% churned out; and at the third interval, 48.4% + 12.2% + 6.4% = 67% churned out. So, after the third interval, 33% of originally sold subscription items remained active.
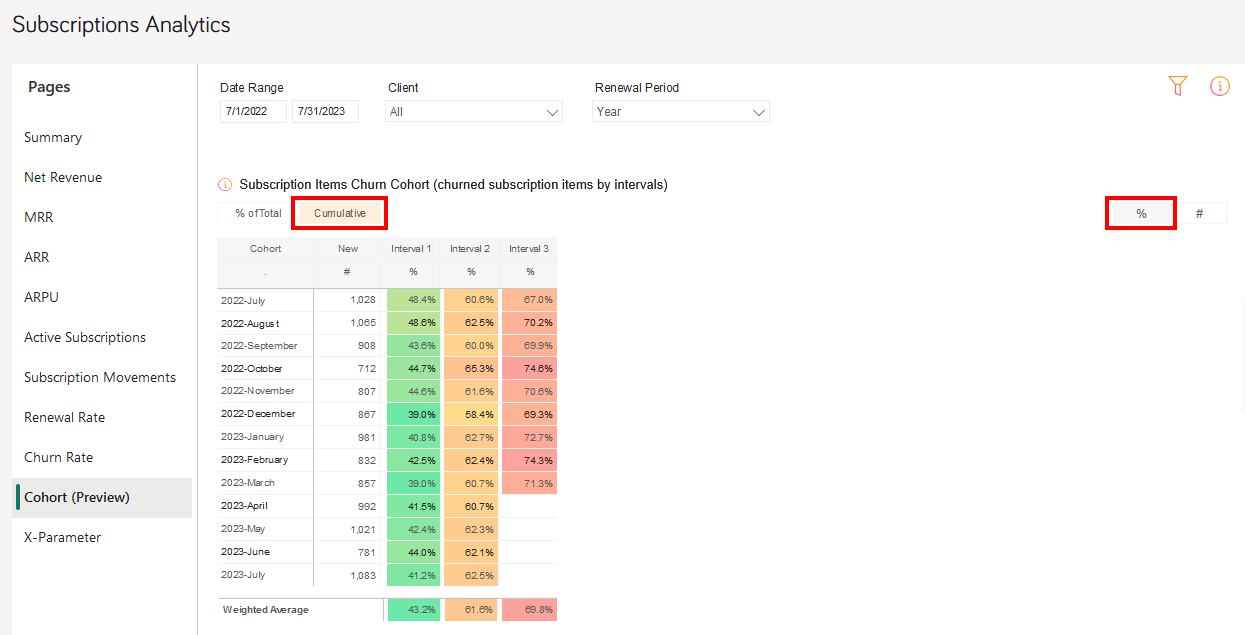 Image 2 – cumulative percentage view
Image 3 shows the count view: from the cohort of 1028 yearly billed subscription items for which customers signed up in July 2022, 498 subscription items churned out at the first interval; another 125 items churned out at the second interval; and a further 66 items churned out at the third interval.
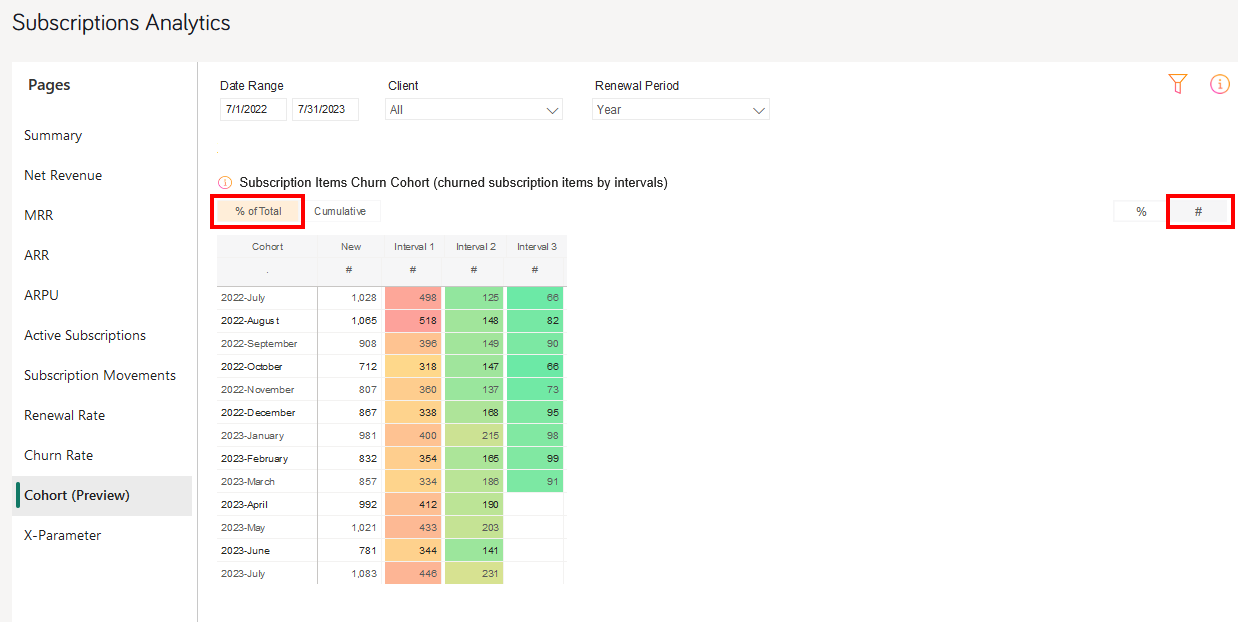 Image 3 – total count view
Image 4 shows the cumulative count view: at the first interval, 498 subscription items sold in July 2022 churned out; then, at the second interval, 498 + 125 = 623 churned out; and at the third interval, 498 + 125 + 66 = 689 churned out. So, from 1028 subscription items originally sold in July 2022, 1028 – 689 = 339 items remained active after the third interval.
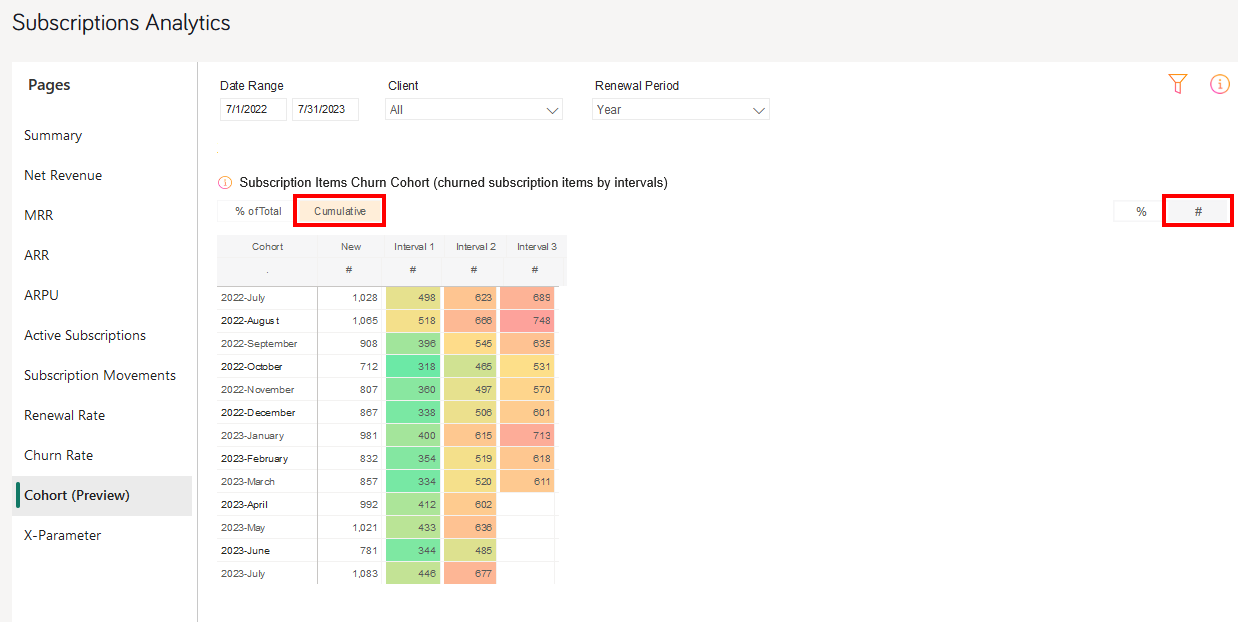 Image 4 – cumulative count view
X-Parameter displays origin of your revenue, subscription movements, and renewal rate as per up to 5 custom x-parameter classes and up to 10 hierarchical x-parameter levels. For more information on x-parameters, see Set Up X-Parameters. X-parameters are variables appended to the order![]() An agreement between a seller and a buyer to exchange goods and/or services for money. An order can: - contain multiple products and quantities; - have multiple financial transactions. A preorder authorization is considered an order. processing URLs that let you:
An agreement between a seller and a buyer to exchange goods and/or services for money. An order can: - contain multiple products and quantities; - have multiple financial transactions. A preorder authorization is considered an order. processing URLs that let you:
- Pass data you want to capture in the order processing, such as sources of revenue, customer information, and affiliate and partner
 A company that buys your products in bulk for a discounted price and resells them to their customers for a profit. In legal terms, a partner is a regular customer as there is no partnership agreement with Cleverbridge in place. information
- Group and track orders for reporting
The various metrics on the X-Parameters bar chart help you measure how successful your different promotional activities are. For more information on how x-parameters are used to pass information through the checkout process to track revenue, see Provide Incentives for Purchase, X-Parameter and Revenue Tracking Reporting, and Set Up Revenue Tracking.
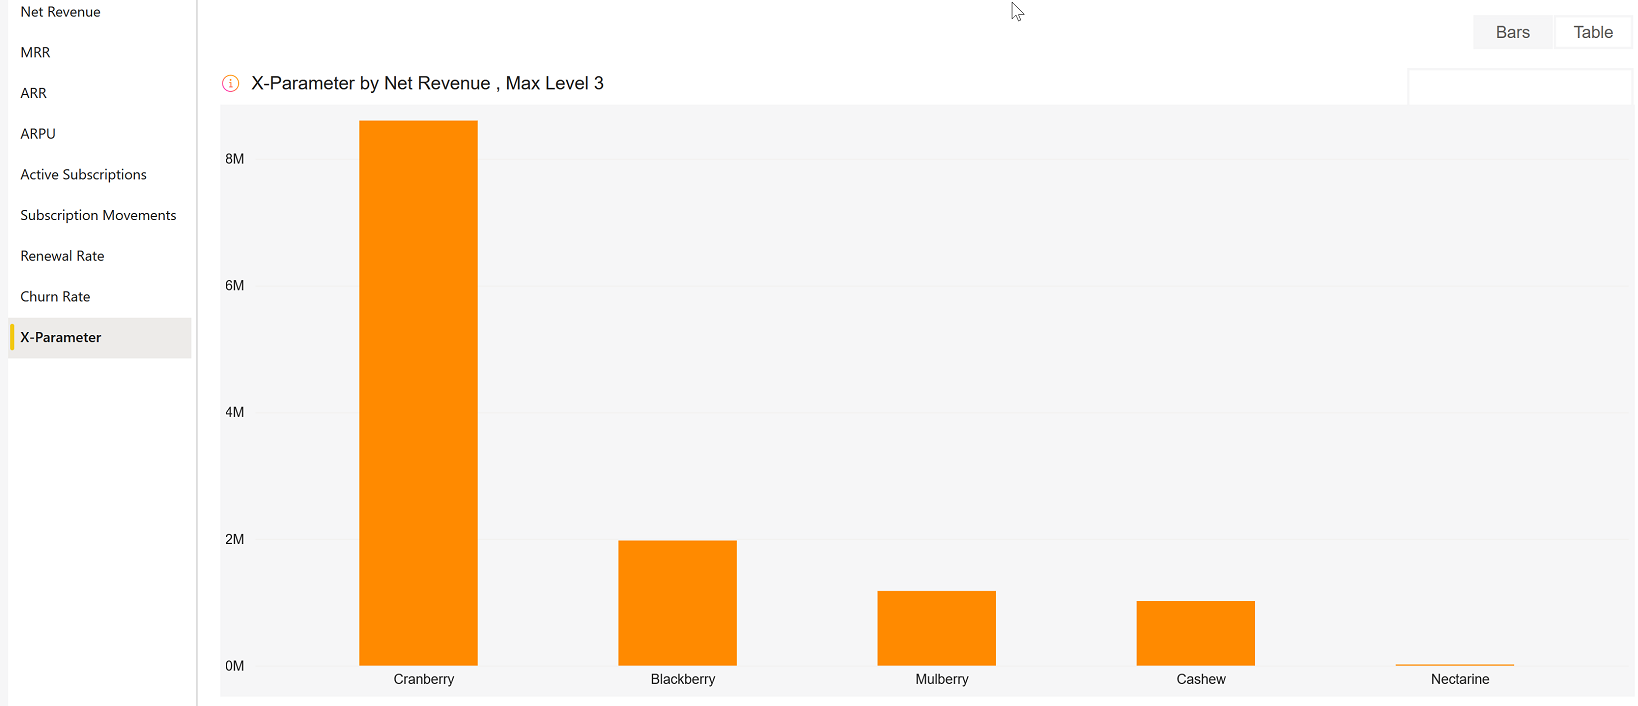
The X-parameters bar chart displays the following metrics for the 5 custom x-parameter classes, which you can drill down to see 9 further x-parameter sub levels:
- Net Revenue
- New Subscriptions
- Renewed Subscriptions
- Churned Subscriptions
- Renewal Rate
The Table tab displays the entire data used to calculate the metrics of the x-parameter bar charts including the x-parameter classes and their sub levels. You can also view the x-parameter table to see the parameter classes and their sub levels.
Important
To use x-parameters metrics and x-parameter filters, first you need to create the x-parameter categories and subcategories in the system. Only then the data gets populated in the x-parameter page and the x-parameter filters.
Filters
In Subscription Analytics, the drop-down elements on the right-hand side and the three filters on top of the metrics allow you to filter the results.
You can also filter data by specific IDs using text search filters.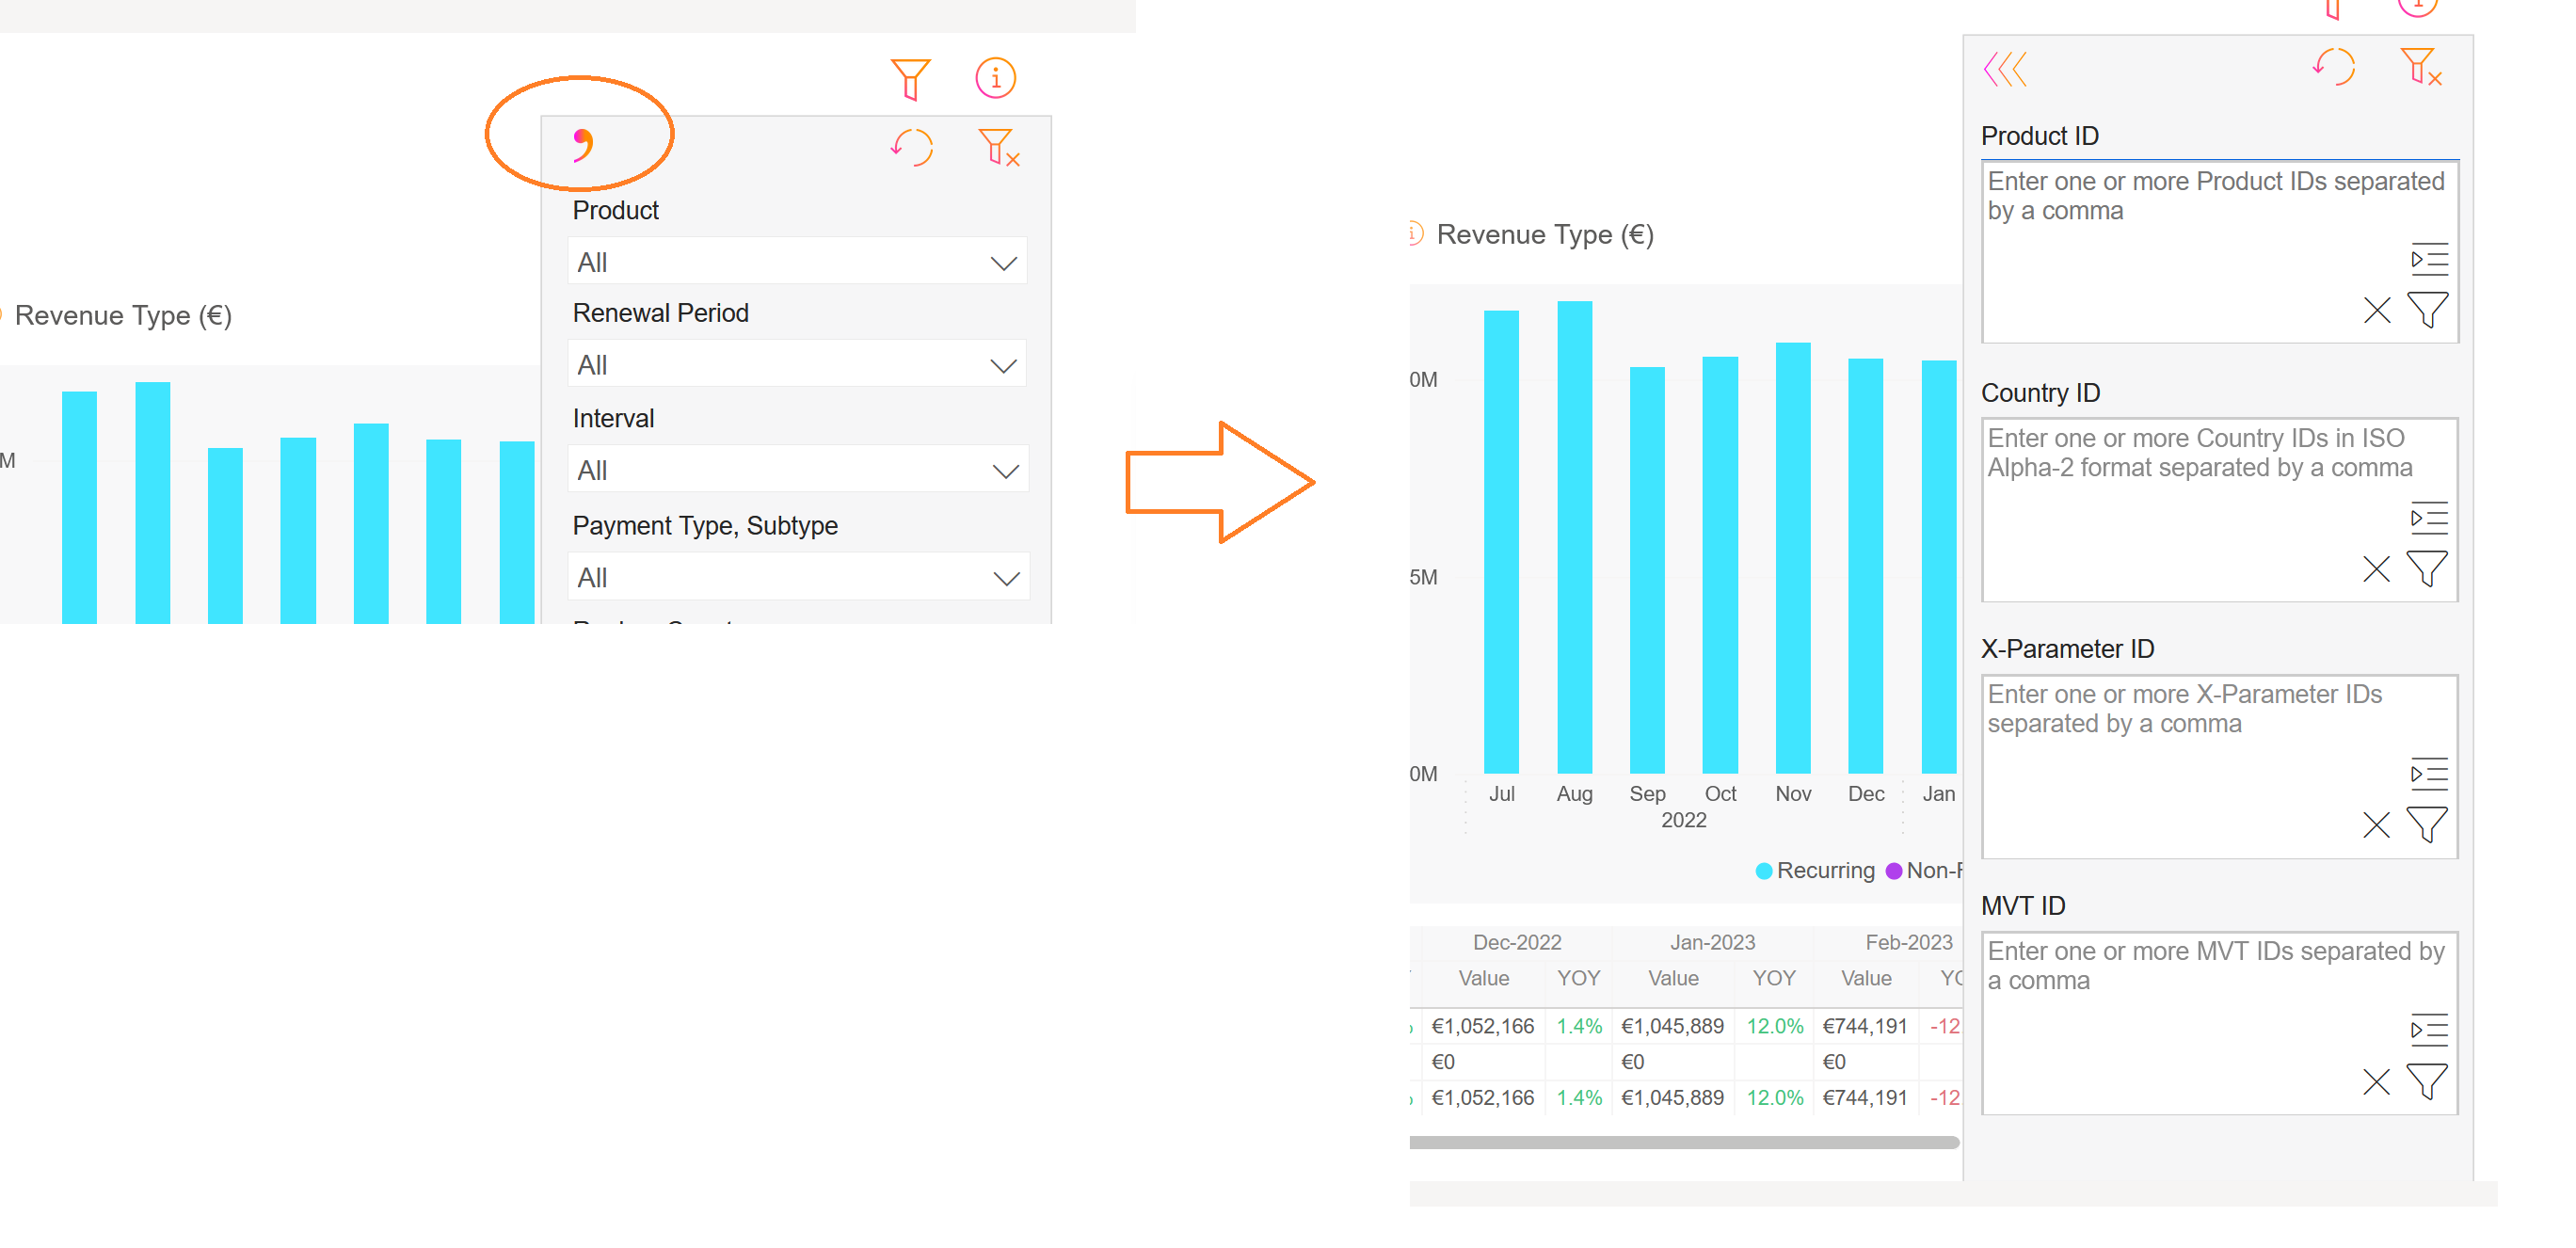
The applied filters are visible above the charts and can be cleared with the X sign.
You can filter the data by:
- Date Range: month-day-year
- Client: Cleverbridge client name/ID
- Currency: USD, EUR, or GBP
- Product: name/ID of the product
- Renewal Period: monthly, yearly, or other subscription running periods
- Interval: subscription item interval number
- Payment Type: payment type Consolidates multiple payment methods into groups by the type of payment the customer uses, for example, Credit Card as a payment type that encompasses Visa Credit Card, Master Card Credit, Amex, in short: all credit cards. used by a customer
- Payment Subtype: payment subtype used by a customer
- Region: world region as defined by Cleverbridge
- Australia
- China
- Hong Kong
- India
- Indonesia
- Japan
- Malaysia
- New Zealand
- Philippines
- Republic of Korea
- Singapore
- Taiwan
- Thailand
- Vietnam
- Albania
- Austria
- Belarus
- Belgium
- Bosnia and Herzegovina
- Bulgaria
- Canary Islands
- Croatia
- Cyprus
- Czech Republic
- Denmark
- Estonia
- Finland
- France
- Germany
- Greece
- Hungary
- Iceland
- Ireland
- Italy
- Latvia
- Liechtenstein
- Lithuania
- Luxembourg
- Macedonia
- Malta
- Monaco
- Montenegro
- Netherlands
- Norway
- Poland
- Portugal
- Republic of Moldova
- Romania
- Russian Federation
- San Marino
- Serbia
- Slovakia
- Slovenia
- Spain
- Sweden
- Switzerland
- Ukraine
- United Kingdom
- Argentina
- Bolivia
- Brazil
- Chile
- Colombia
- Costa Rica
- Ecuador
- El Salvador
- Guatemala
- Honduras
- Mexico
- Nicaragua
- Panama
- Paraguay
- Peru
- Puerto Rico
- Uruguay
- Venezuela
- Canada
- United States
- Country: billing country
- Business Category: B2C or B2B
- MVT Multivariate testing (MVT) is a technique for testing two or more different variables in the checkout process to determine which variable creates more revenue or a higher conversion rate.: Multivariate testing campaign name / ID
- Partner: Another business that buys your products in a business-to-business (B2B) model. Partners purchase your products at a discount and then sell them to customers. Partners communicate directly with customers.
- X-Parameter Class: These are your predefined x-parameter classes. You can have a maximum of 5 x-parameter classes per client in the system. When you select an X-Parameter Class filter, it is applied to the metrics and the x-parameters under the x-parameter class appear in the X-Parameter filter drop-down, which you can further select to filter the metrics. You can select either one x-parameter class as a filter or all the available x-parameter classes.
- X-Parameter: X-Parameter represents origin of your revenue and subscriptions and there can be a maximum of 10 hierarchical x-parameters levels in the system. You can select X-Parameter filters to see the subscription/revenue reports. You can either select one x-parameter as a filter or all the available x-parameters. For more information on x-parameters, see Set Up X-Parameters, X-Parameter and Revenue Tracking Reporting, and Set Up Revenue Tracking.
| Cleverbridge Region | Countries |
|---|---|
| APAC |
|
| EUROPE |
|
| LATAM |
|
| NOAM |
|
| ROW | All others |
Tip
To quickly find a specific campaign in a long list of entries in the X-Parameter field, utilize the search feature by typing in either the name or ID of the campaign for which you wish to filter the data.
Important
In Subscription Analytics, you can apply X-Parameter Class and X-Parameter filters only to the following metrics. These filters appear when you open the metrics to which they are applicable by clicking on their respective boxes or on the metric name list on the left side.
- Net Revenue
- Subscription Movements
- Renewal Rate
- X-Parameter
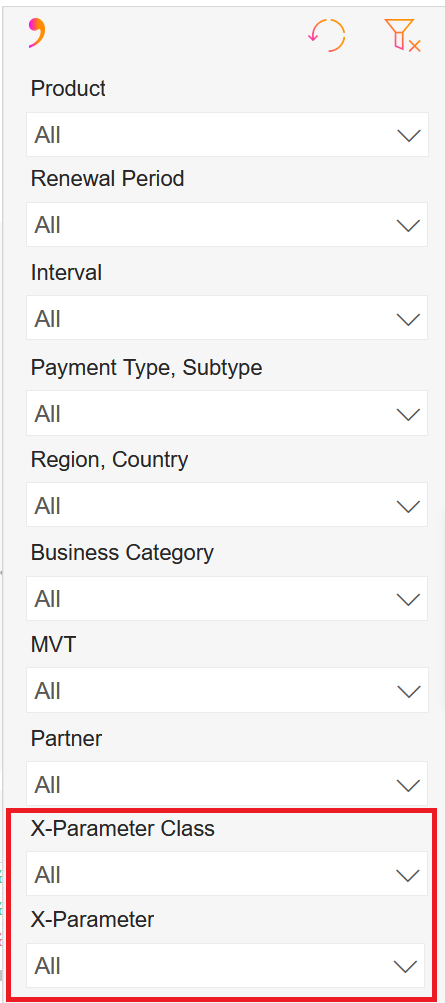
Chart Features
Hovering over each chart’s title displays a brief explanation of the shown KPI and how it is calculated.
Hovering over any of the bars or lines in any of the charts above, gives you more detailed data. For instance, the Subscription Movements chart displays the following data for the month of February 2022:
You have the option to drill up in each chart and change the view from monthly to quarterly and to annually by hovering anywhere over the chart and then clicking on ![]() on top of the chart. If you want to go back to the quarterly or monthly view, click on
on top of the chart. If you want to go back to the quarterly or monthly view, click on ![]() .
.
The table at the bottom of the page shows the data used to calculate the KPIs of the charts. Clicking on any of the bars or a month in the line chart will hide the numbers of all other months in the table.