Configure advanced reports in BI
Overview
With Business Intelligence (BI), you can create detailed, near real-time reports by selecting measures to report and dimensions that group and filter data results. BI analyzes large quantities of information, which can be drilled down to an increasingly granular level.
You can use BI reports to determine, for example:
- How much revenue you made last month.
- If your email promotion is working.
- Which MVT candidate is performing better.
- Average cart value this week compared to last week.
Configuring a report is highly flexible and customizable. This enables you to get results that meet your organization business needs. For example, you can build reports based on different markets and regions. You can break the information down by type of customer and their location, browser, language, IP address, and more. You can then use this information for optimizing your business.
In BI, you can also use and access reports which are pre-defined.
Additionally, you can:
- bookmark the reports you configure and easily access them for future use either in BI or in SCM.
- export the reports.
Configure a report in BI
1. Select what to report
-
In the Available Measures section, select:
- Most Common tab for the most commonly used measures.
- All tab for a list of all possible measures.
-
Select a measure. For the descriptions of all measures, click the blue help button to the right of each measure.
-
Drag and drop the measure to the Selected Measures section on the left. The measure displays with a drop-down list below it.
-
In the drop-down list, select the type of payment status which you want to base the report on.
- If needed, add more measures or remove any of the measures by clicking the red x to the right.
In the Most Common tab, you select Sales Revenue (Client). Any report generated with this measure will be a sales revenue report. In the drop-down list, you select Paid (Aggregated). The report will display paid orders that include refunds, returns, and revenue.
2. Select how to report
Select how to report the measures with one or more dimensions. To run the report, you must select at least one dimension in the Dimension Group section.
- Customize the report view. In the Dimension Group section, there are two options:
- X-axis, which is a horizontal axis of the report (when in chart form) typically used for item selection.
- Y-axis, which is a vertical axis of the report (when in chart form) acting as the secondary axis.
You selected Sales Revenue (Client) as the measure and Time as the dimension for the x-axis. The report displays the sales revenue numbers on the y-axis and the time increments, such as months, on the x-axis.
-
Decide how to filter the report, which is a way to include or exclude only a subset of returned data. You can select a filter in the Dimension Filter section.
-
In the Available Dimensions section, select either the Most Common tab for the most commonly used dimensions or All - for the list of all possible dimensions.
-
Select a dimension. For descriptions of all dimensions, click the blue help button to the right of each dimension.
-
Drag and drop the dimension to the X-axis, Y-axis, or Dimension Filter sections on the left. The dimension displays with more selectable options.
-
If needed, further refine the dimension by selecting additional options or remove a dimension by clicking the red x to the right.
One of the most commonly used dimensions is Time. Use it to select or change the period covered by the report and to group the returned data by month, day, or hour.
3. Run a report
To run or refresh a report, click the green button in the top-right corner of the screen or press F5.
There are limitless possibilities of how you can configure a BI report. This procedure provides general guidelines.
Additional report settings
If needed, you can configure additional report settings that determine how the reports and data are calculated. For example, you can set the exchange rate time, currency, and time zone. To do this, in the Global Header, click Additional Settings. A window with the options displays.
These settings are reset to default when you close and reopen BI. If you want to save the customized settings, best practice is to save reports with those settings as bookmarks.
If you wish to have custom defaults for all users in your company, contact Client Experience.
Measures settings
In the Measures tab, select from the available options:
Time settings
In the Time tab, select from the following options:
Miscellaneous settings
In the Miscellaneous Settings tab, select how to display data for test orders:
- No tests (default): The report displays no test orders.
- Only tests: The report displays only test orders.
- All: The report displays both test and regular reports.
View and work with report results
Display type
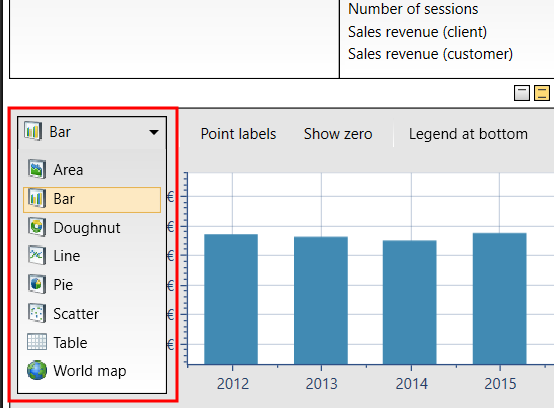
You can select a display type for the report in the top left corner of the results pane. The options are as follows:
- Area (only available for the Time dimension).
- Bar
- Doughnut
- Line (only available for the Time dimension).
- Pie
- Scatter
- Table
- World map (only available for one measure and up to two dimensions, one of which must be the Country dimension).
Display options
There are various report display options on the top of the results pane which vary according to the display type (area, bar, and so on). Click the button to turn on the following options:
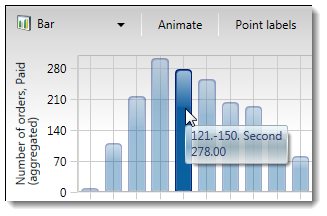
Tooltips with data
Hover the mouse pointer over the data, such as a bar in a bar chart, for a tooltip that displays information about the data.
Drill down to more specific data
You can drill down through data layers to get more specific data in BI.
Double-click
Double-click to further drill down in the same report. This works for the following dimensions, which have a hierarchical structure:
View double-click drill-down behavior
- Browser, with versions
- Country, with states
- Customer Contact Reason, with detailed reasons.
- MVT campaigns, with candidates in a campaign.
- Operating System, with version
- Parameter (for X-Parameter revenue tracking), with the hierarchy for the selected parameter tree.
- Payment Types, with subtypes
You run a report for sales revenue by browser and select the Bar display type. You double-click the bar for Google Chrome. The report refreshes and displays all versions of Google Chrome.
Highlight a section of the report
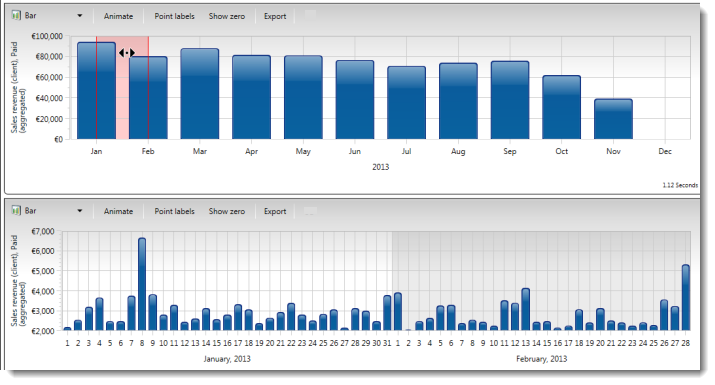
If you are running the report with the Time dimension, you can highlight a section of the report to open a more detailed report below it. The report below displays the next level of detail, such as from year to month, or from month to day, and so on. To do this:
- In the results pane, select the Bar report type.
- Click on a bar. A red line displays.
- To display more data for only that bar, release the mouse click. A second report with detailed data displays below.
- To display more data for a wider time period, drag the cursor over more bars in the report and release the mouse click. A second report with detailed data displays below.
- To further refine results:
- Hover the mouse pointer over the left or right edge of the highlighted section and drag the highlighting to a new position.
- Hover the mouse pointer over the highlighted section and right-click. While holding the click, drag the entire highlighted section to a new position.
- To further refine the results:
- Hover over the left or right edge of the highlighted section and drag the highlighting to a new position.
- . Hover over the highlighted section and right-click. While holding the click, drag the entire highlighted section to a new position.
You run a report for sales revenue by the last year, grouped by month, and select the Bar display type. You highlight two bars of the report that represent two months: January and February. A detailed report displays below the report with data for each day of the highlighted two months.
Context menu
Right-click the report results to view a menu with options to select a subset of data, such as All Countries or Top Languages. When selected, the report refreshes to display the data by that subset.
You run a report for sales revenue. You right-click the report results and select Browsers. The report refreshes and now displays revenue by browser type.