Churn Prevention analytics
Introduction
When a subscriber initiates cancellation by toggling off automatic renewal in the subscription portal, they are guided through an adjustable multi-step flow that encourages them to stay:
- Benefit reminder: A popup shows the value of staying subscribed.
- Exit survey: The customer selects a cancellation reason. Each survey option is tied to reporting via a Reporting Key.
- Tailored offer: Based on their answer, they may receive a discount, be offered a product change, or be encouraged to reach out to support.
- Outcome: The user either stays on auto-renewal or switches to manual renewal.
If a subscriber drops off during the process or accepts the offer, they remain on auto-renewal.
See Prevent churn with cancellation flows for more details.
The Churn Prevention Report helps you understand how customers interact with the cancellation process, why they want to leave, and how effective your retention tactics are at keeping them subscribed. Use it to track cancellation outcomes, measure saved revenue, and identify areas for improvement.
Access the reports
To access the report, go to the Analyze section of SCM and select Cancellation Flow from the menu.
You must have Subscription Management 2.0 enabled and the cancellation flow feature activated. If you don’t see the report, reach out to your Client Experience contact to request access.
Information available on the Performance tab of the report
The Churn Prevention report offers both high-level insights and granular data across two main tabs: Performance and Responses:
- Use the Performance tab to track outcomes, visualize customer behavior in the cancellation flow, and evaluate retention performance.
- Switch to the Responses tab for a detailed view of individual cancellations, including survey feedback and revenue data
By default, you will see the Performance tab of the report.
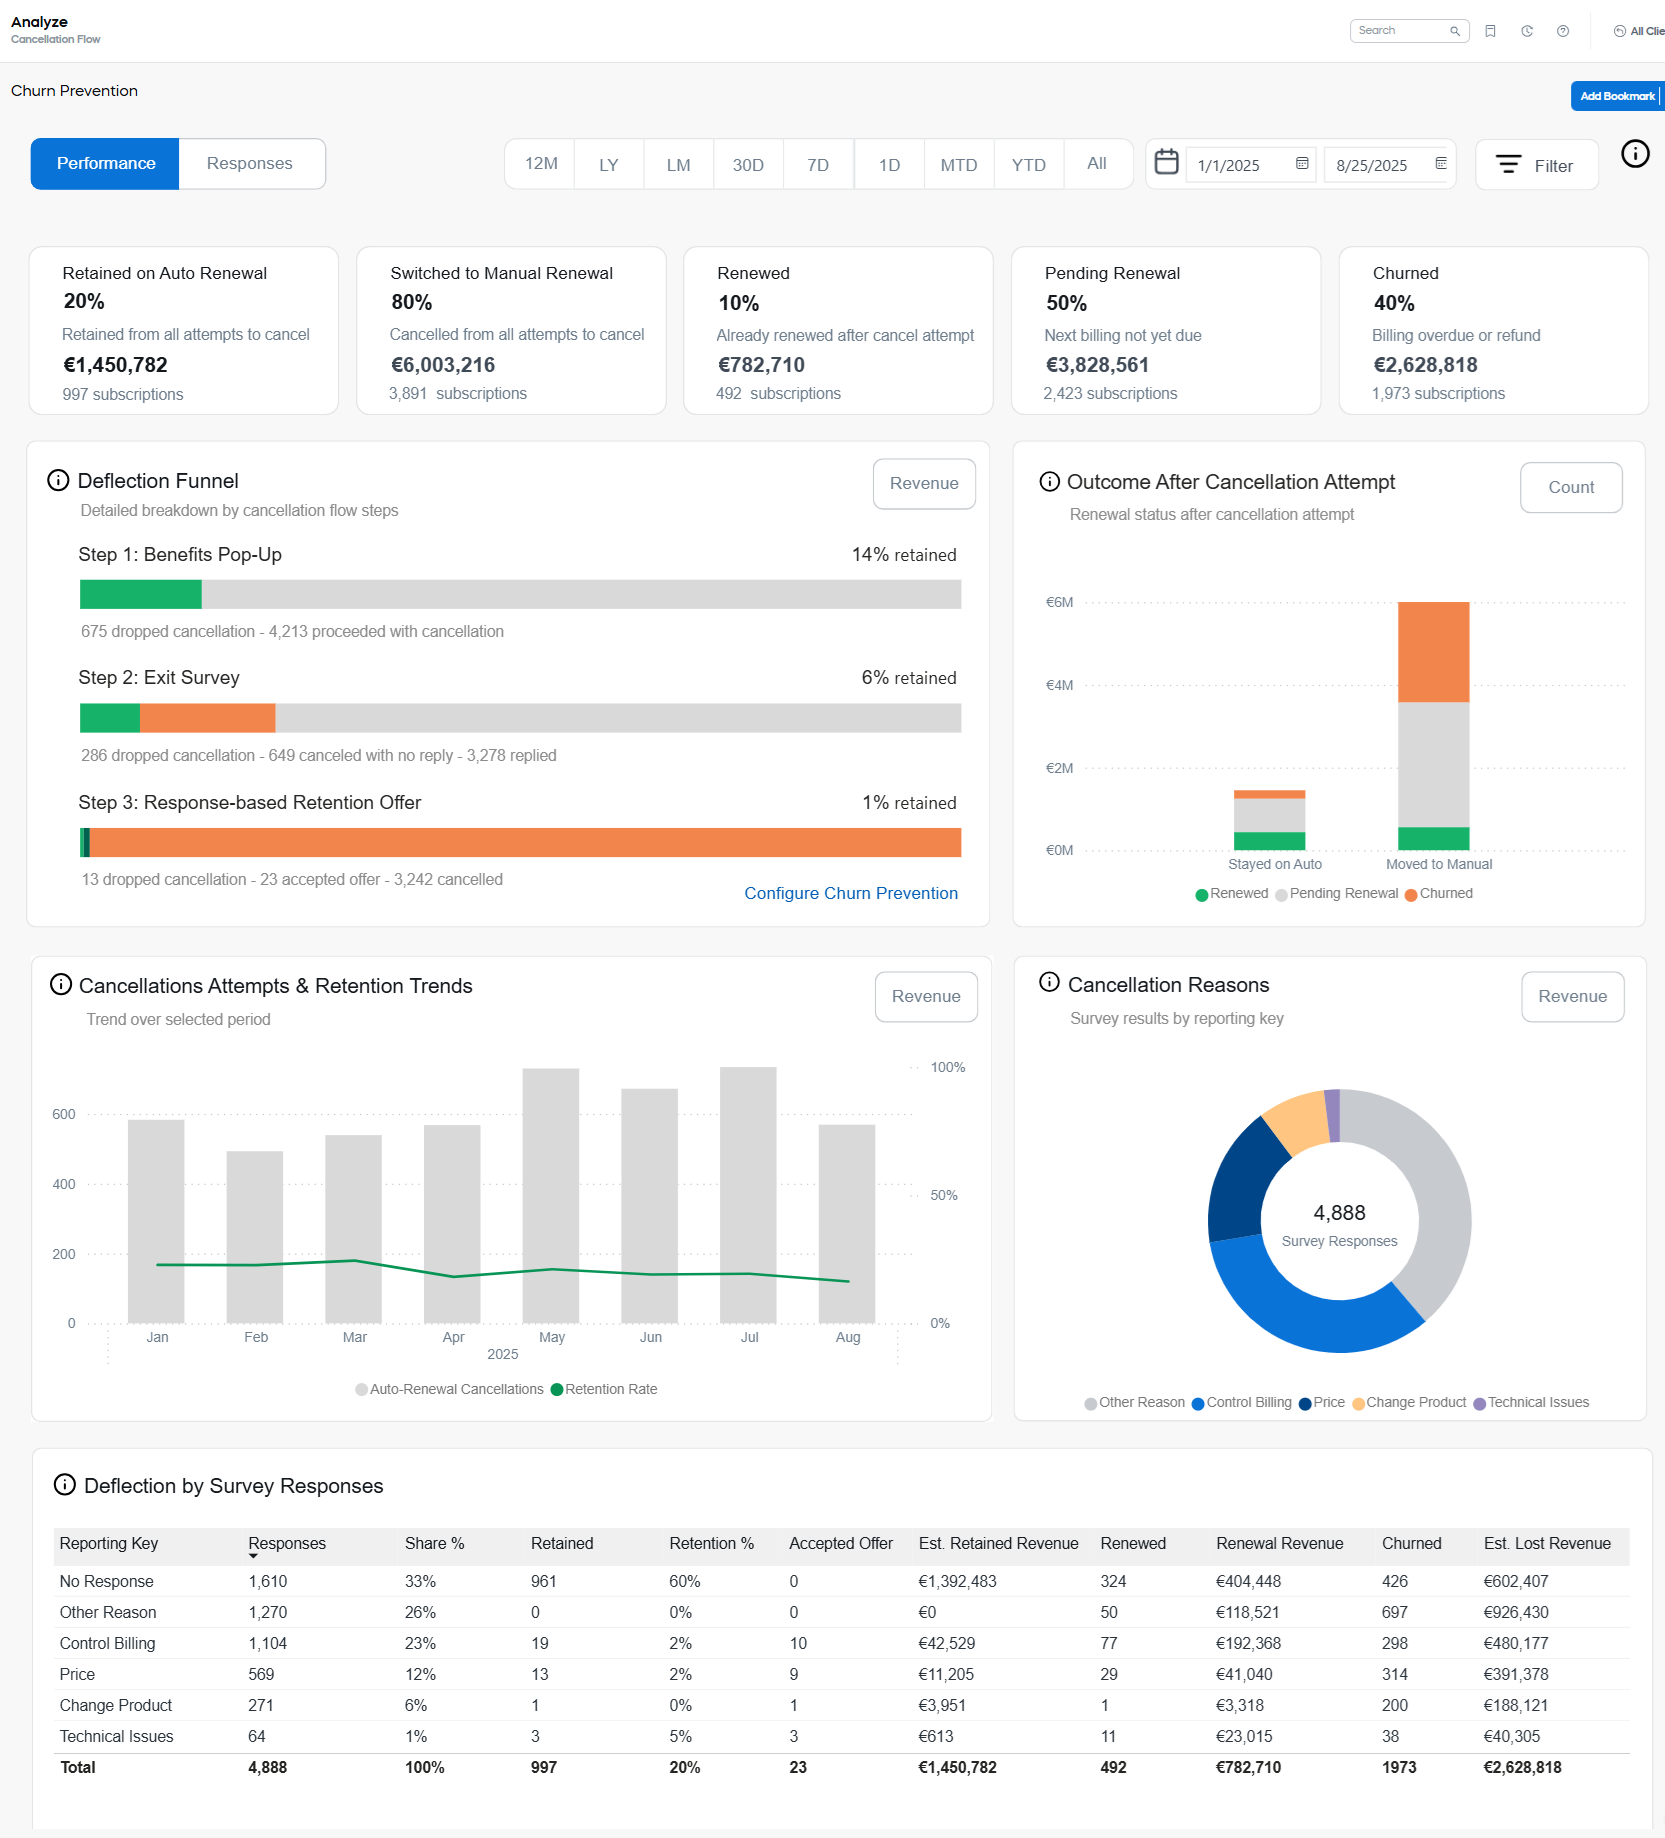
Key Metrics Overview
At the top of the report, you’ll see a snapshot of the most important metrics that help you evaluate how subscribers behave during the cancellation process and how much revenue is at stake.
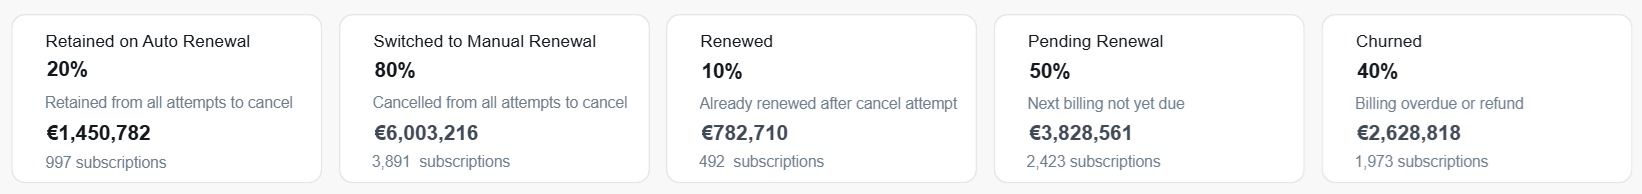
- Retained on Auto Renewal: The number and percentage of subscribers who remained on auto-renewal either by abandoning the process or by accepting a counteroffer.
- Switched to Manual Renewal: Subscribers who completed the cancellation flow and successfully turned off auto-renewal.
- Renewed: Subscriptions that have renewed to the next billing interval (either manually or automatically) after the most recent cancellation attempt. Refunds are excluded from the revenue calculation.
- Pending: Subscriptions that are scheduled for cancelling at the end of the billing period. The next billing date hasn’t occurred yet, so they can still renew.
- Churned: Subscriptions that did not continue past the current period due to one of the following:
- The next billing date passed without successful payment.
- A chargeback occurred.
- The subscription was fully refunded.
Each metric also includes the associated revenue to show the financial impact of each outcome.
Deflection Funnel
The Deflection funnel visualizes how subscribers move through each stage of the cancellation flow, and where retention efforts succeed or fall short. By default, the data is displayed by number of subscriptions but can be switched to view the corresponding revenue values.
Basically, the report is a step-by-step breakdown of your configured Cancellation Flow, indicating where customers are retained (they drop the cancellation or accept an offer), where they continue to the next step, and where they complete cancellation. The three steps in the chart mirror the flow you configure: the initial benefits pop-up, the exit survey, and any response-based retention offer such as a discount, change-plan prompt, contact-support link, or a simple “no incentive” path.
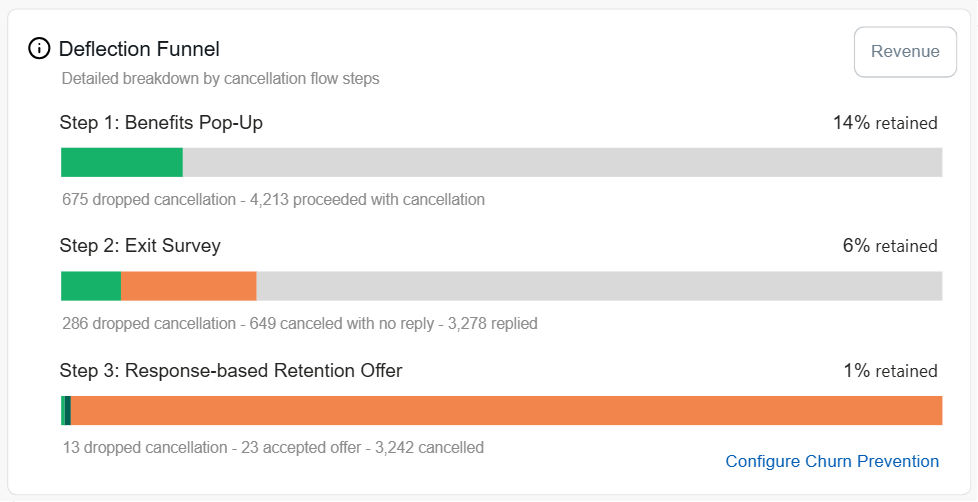
Click the Revenue button in the top right corner of the tile, to see the data by estimated revenue.
The Configure Churn Prevention link in the corned of the Deflection Funnel tile, will take you directly to the the Cancellation Flow management page, as described in Prevent churn with cancellation flows.
Outcome After Cancellation Attempt
This chart helps you evaluate what happens to subscriptions after a cancellation attempt — whether they stayed active, churned, or are still pending renewal. This way you can get insight into whether retention is holding long-term or just delaying churn.
You can view this data by number of subscriptions or by estimated revenue. By default, the data is displayed by number of subscriptions.
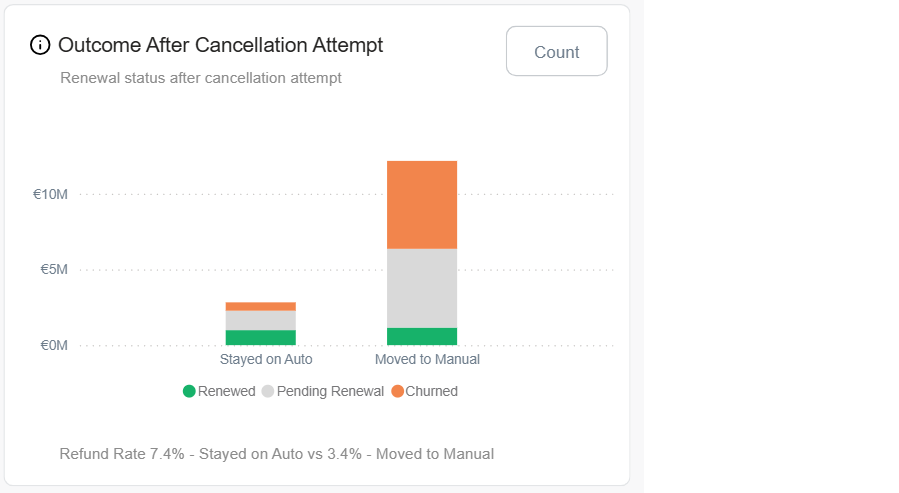
The report groups the outcomes by final cancellation result:
- Stayed on Auto: Subscriptions that remained on auto-renewal.
- Moved to Manual: Subscriptions where the auto-renewal was turned off.
Within each group you can see the same three outcomes:
- Renewed: Subscriptions that were successfully renewed.
- Pending Renewal: Subscriptions that haven’t reached their next billing date yet.
- Churned: Subscriptions that did not result in a kept renewal.
Refund Rate
Below the Outcome After Cancellation Attempt chart, you can see the Refund Rate details. This is the percentage of subscriptions that were refunded after a cancellation attempt, calculated separately for those subscriptions where the customer stayed on auto-renewal and for those where the customer renewed manually.
It is calculated as subscriptions refunded after a cancellation attempt ÷ (renewed subscriptions + refunded subscriptions). In other words, it indicates the share of subscriptions that renewed but were later refunded.
If a subscriber requested a refund for the current interval before canceling auto-renewal, the subscription is counted as Churned, as the refund happened before the cancellation attempt.
High Refund Rate values suggest that subscribers may have believed they canceled successfully, but were still charged. This is an important signal of customer confusion and dissatisfaction.
Cancellation Attempts & Retention Trends
This timeline chart shows how cancellation attempts and retention rates evolve over time. It helps you identify trends, spot seasonal spikes, and evaluate the effectiveness of your cancellation flow on a month-by-month basis.
You can view this data by number of subscriptions or by estimated revenue. By default, the data is displayed by number of subscriptions.
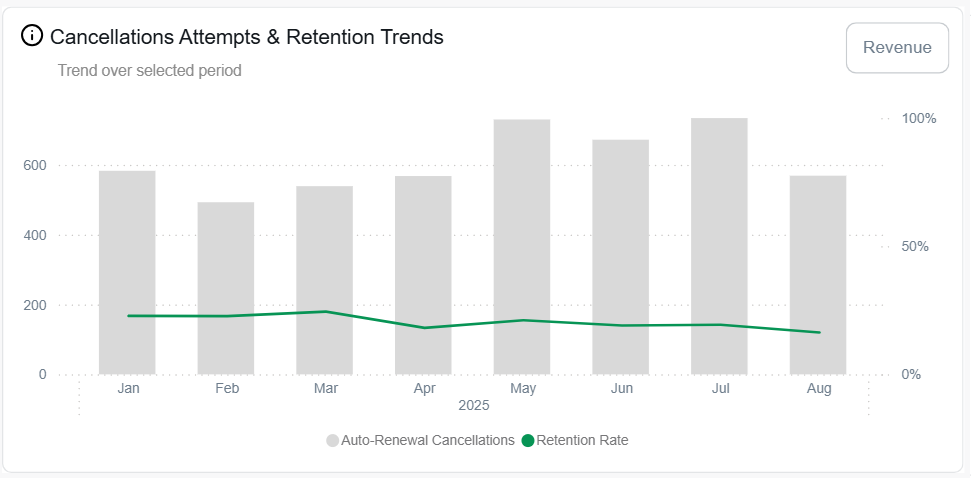
- Auto-Renewal Cancellations (grey bars): The number of subscriptions for which there was reported an attempt to cancel auto-renewal in a given month.
- Retention Rate (green line): The percentage of those subscriptions that stayed on auto-renewal after the attempt.
Click the Revenue button in the top right corner of the tile, to see the data by estimated revenue.
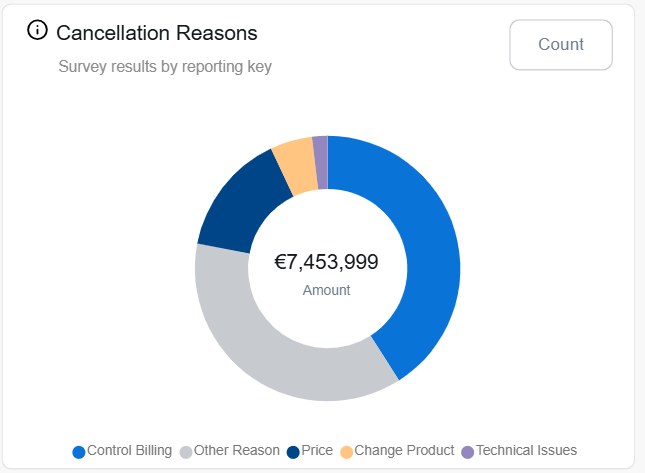
Cancellation Reasons
This donut chart summarizes the reasons subscribers give for canceling auto-renewal. The data is based on responses to the exit survey and helps uncover the underlying causes of churn risk. The values are the keys configured for each exit survey option of your cancellation flow.
Understanding the reasons for cancellation can help you optimize offers, improve user experience, and reduce churn at the source. You can view this data by number of subscriptions or by estimated revenue. By default, the data is displayed by number of subscriptions.
The Deflection by Survey Responses table
This detailed table shows how different cancellation reasons impact deflection and renewal rates. It helps you evaluate which responses are most likely to be deflected — and which ones might need stronger countermeasures.
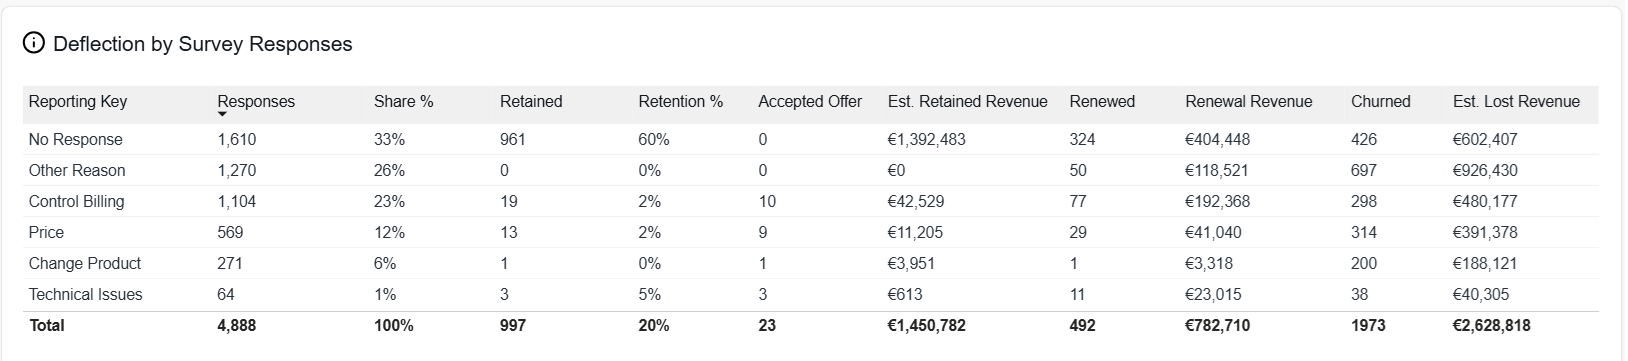
Key columns include:
- Reporting Key: The keys configured for each exit survey option of your cancellation flow.
- Responses and Share%: Count of responses for that exit survey option, and its share of all responses.
- Retained and Retention %: Subscriptions that stayed on auto-renewal right after the cancel attempt (drop-offs or accepted offers), and their percent from the total number of cancellation attempts.
- Accepted offer: How many customers took a counter-offer in the flow.
- Est. retained revenue: Forecast revenue tied to those retained subscriptions.
- Renewed and Renewal revenue: Subscriptions that later renewed (automatically or manually), and the revenue collected from those renewals.
- Churned and Est. lost revenue: Subscriptions that failed to renew or were churned, and the revenue impact.
This view is especially useful for identifying which survey responses result in low retention, so you can fine-tune your cancellation flow offers and messaging.
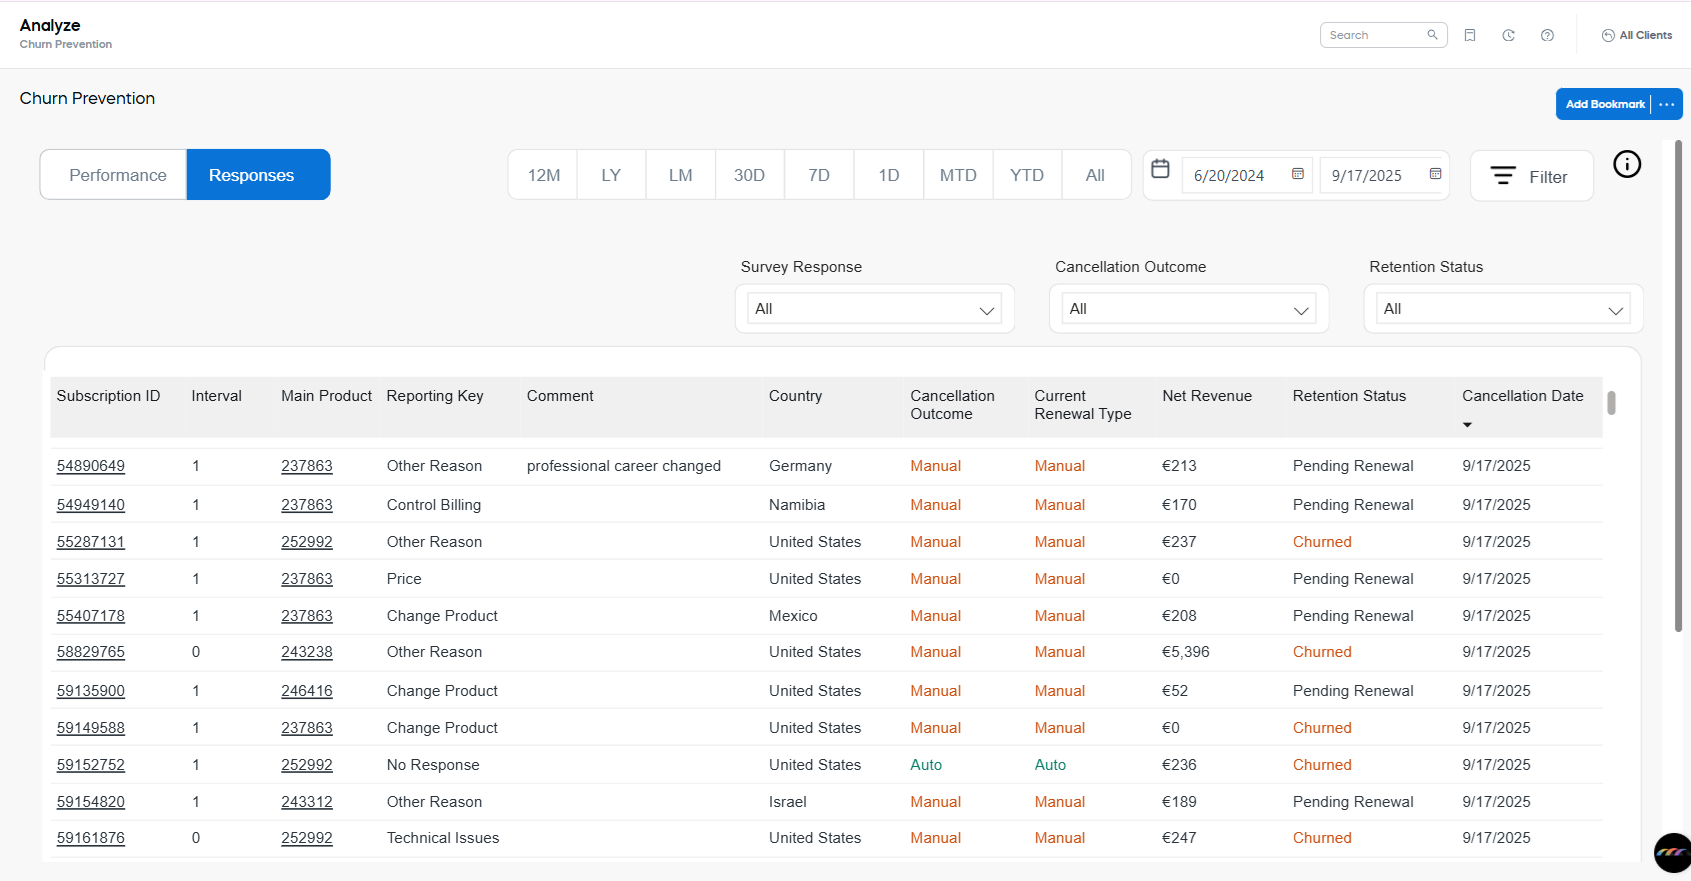
Responses Tab
Click Responses in the top right corner to switch to the Responses tab. The tab provides detailed, subscription-level data about each cancellation attempt — allowing you to drill down into individual customer feedback and actions.
-
Subscription ID: Unique identifier of the subscription. Clicking it will take you to the Subscription Details page.
-
Interval: The billing interval to which the cancellation attempts is attributed.
-
Main Product: The product associated with the subscription during the interval when the cancellation attempt occurred. If the subscription contains more than one item, the Main Product is defined as the most expensive item in the current subscription interval.
-
Reporting Key: The key configured for the exit survey option of your cancellation flow.
-
Comment: Free text comment left in the exit survey response (if any)
-
Cancellation Outcome: Final decision of the customer:
- Auto: Stayed on auto-renewal
- Manual: Moved to manual renewal
-
Current Renewal Type: What renewal type is selected at the time of the report generation. (For example, the customer may move to Manual at the end of the exit survey, but return to Auto later).
-
Net Revenue: Revenue in the selected currency (as chosen in the Filters):
- For Renewed subscriptions: Actual revenue gained with the renewal to the next interval.
- For Refunded subscription: Actual refunded revenue.
- For Pending and Churned subscriptions: Estimated revenue of the next billing interval.
-
Renewal Status: Current status of the subscription.
- Renewed: Indicates that after attempt to cancel the next closes interval was paid. (Does not indicate if the subscription is active at the time of the report generation).
- Pending: Indicates that there has been an attempt to cancel the subscription during the billing period that is not yet over. The subscription may still be renewed before the end of the billing period.
- Churned: Indicates that the subscription was cancelled and was not renewed in the following billing interval.
- Refunded: Indicates that the subscription was renewed, but then chargeback or full refund took place. Refunded subscriptions are also included in the number of Churned subscriptions.
-
Cancellation Date: The date of the attempt to cancel the subscription.
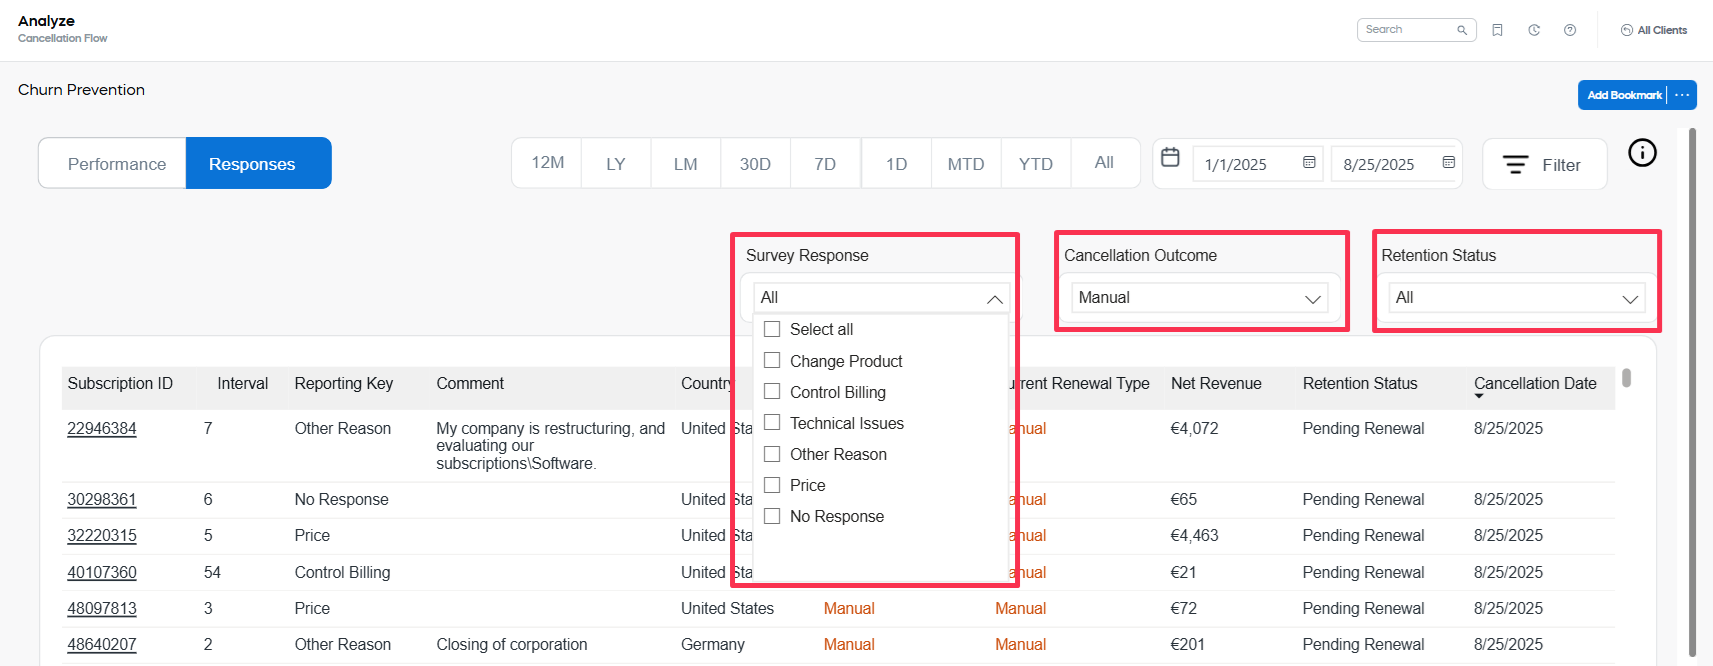
Response Filters
You can filter the response table by specific survey responses, cancellation outcomes, or retention statuses.
Overall report filters
Regardless of the chosen tab, you can filter the reported data by time range, client, currency, and several subscription characteristics. These filters help you narrow the analysis down to specific audiences or behavioral segments.
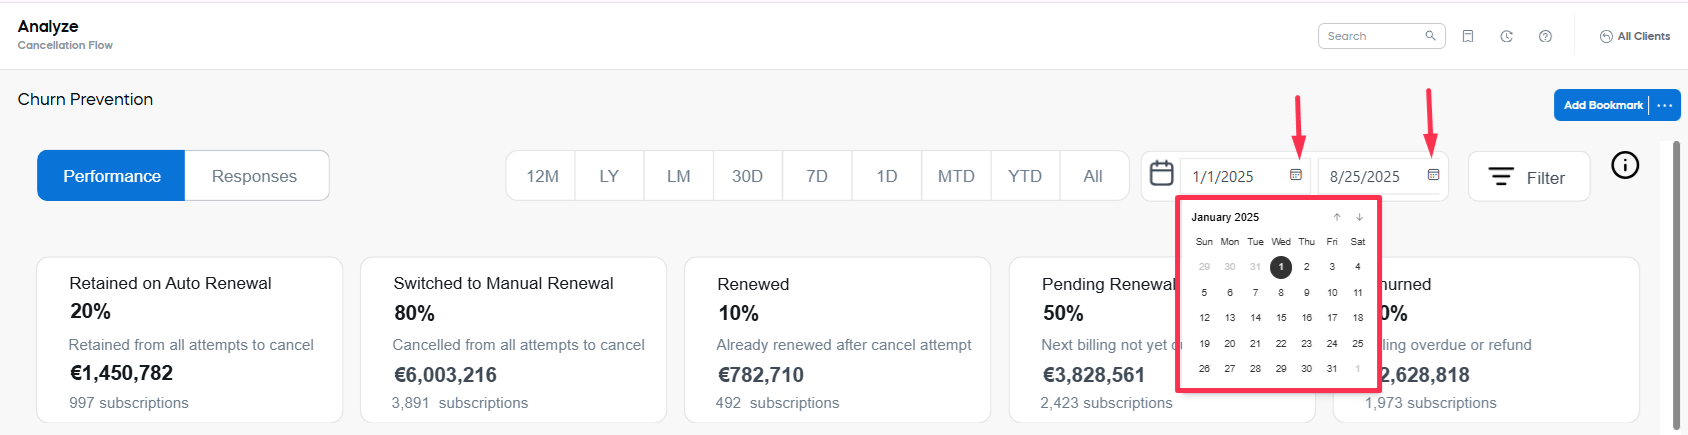
Adjust the time range
Use the calendar picker to define a custom start and end date for your report. Only cancellation attempts within the selected period will be included.
Other filters
To refine your analysis further, use any combination of the following filters:
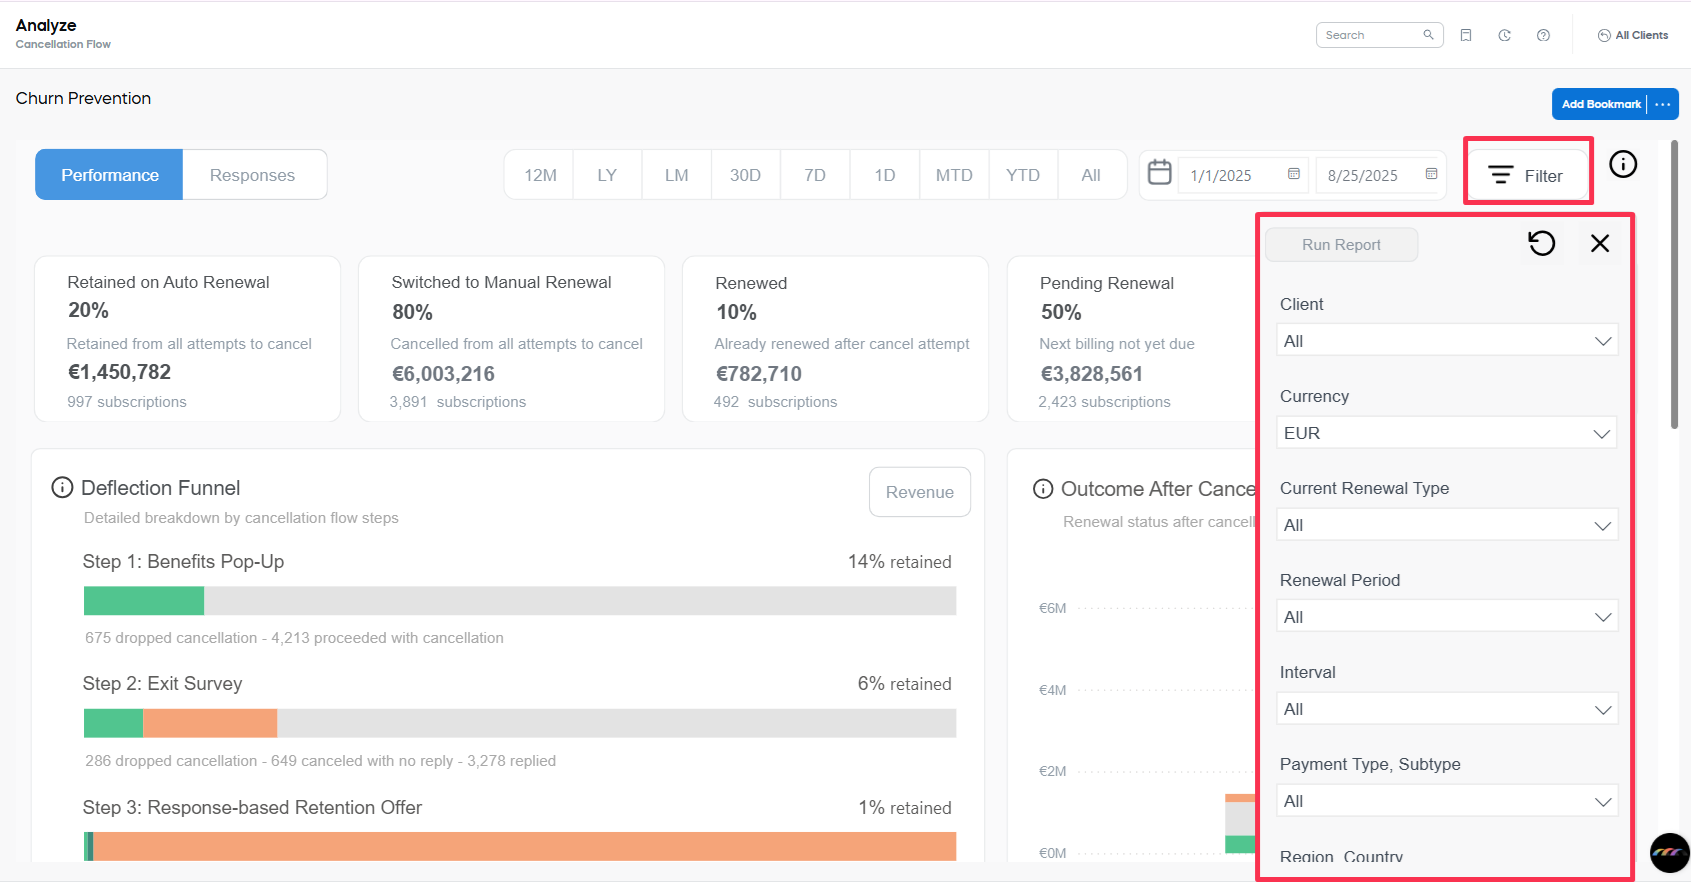
Available filters include:
- Client: Filter by specific client accounts you have access to.
- Currency: Filter by the reporting currency, for example, EUR, USD, GBP
- Current Renewal Type: Filter by whether the subscription is currently set to auto or manual renewal.
- Renewal Period: Filter by billing cycle frequency (for example, Month or Year)
- Interval: Filter by subscription billing interval index (0 = first interval, 1 = second, etc.). This is particularly useful for understanding behavior over the lifecycle of long-term subscriptions.
- Payment Type, Subtype: Filter the report based on the payment method used for the subscription. This allows you to analyze trends or cancellation behaviors associated with specific payment channels.
- Region, Country: Use this filter to limit your analysis to specific geographical locations. You can select from global regions and drill down into individual countries if needed.
- B2B / B2C: Filter by customer type to distinguish between business and consumer subscriptions.
- Current Renewal Type: Filter by the renewal type the subscription is currently set to (automatic, manual, or both).
- Promotion: Filter by (promotions)https://subcomm.cleverbridge.com/1479/optimize/promotions/item_level applied to the Main Product. If the subscription contains multiple items, the filter uses the promotion linked to the most expensive item.