Payment analytics
The Analyze > Payments dashboard helps you monitor payment performance, understand revenue trends, and evaluate how Cleverbridge revenue retention tools affect your results. The dashboard is organized into pages that reflect different stages of payment processing and revenue optimization. Each page contains one or more report groups, and each group contains individual reports for specific metrics.
Use this dashboard to answer questions such as:
- Which payment methods generate the highest revenue.
- How payment success rates change over time.
- Which credit card schemes perform best during authorization.
- How much revenue is recovered through retention tools.
- Which regions, countries, renewal types, or order types perform better or worse than others.
Payment analytics provide data to be used only as a reference. If you want to generate reports for accounting purposes, use the clearing documents.
Access payment analytics
You can access the reports in Analyze > Payments after you have successfully completed the onboarding process. If you do not yet have access to the dashboard, contact Client Experience.
Understand the dashboard structure
The Payments dashboard is organized into pages, report groups, and individual reports. This structure helps you move from a broad payment-processing view to more specific metrics and detailed breakdowns.
Report pages
The Payments dashboard is divided into four main pages:
- Payment Success: Helps you understand how many submitted orders result in successful payments and how much net revenue they generate
- Purchase Authorization: Helps you evaluate credit card authorization performance and the impact of Cleverbridge revenue retention tools on successful credit card transactions
- Revenue Recovery: Helps you measure the revenue and orders recovered by Cleverbridge retention tools
- Card Acceptance: Helps you analyze the performance of card payments across fraud checks, authentication, and final payment outcomes
After you select a page in the left navigation, you can switch between report groups and individual reports within that page.
For example, on the Revenue Recovery page, you can switch between the Revenue Recovery, Account Updater, Exp. Date Checker, Dynamic Re-routing, and Retry Logic report groups. Within each group, you can then switch between the available reports for that group. For example, the Account Updater group contains the Account Updater Success Rate, Updated Cards, and Paid Orders with Updated Cards reports. 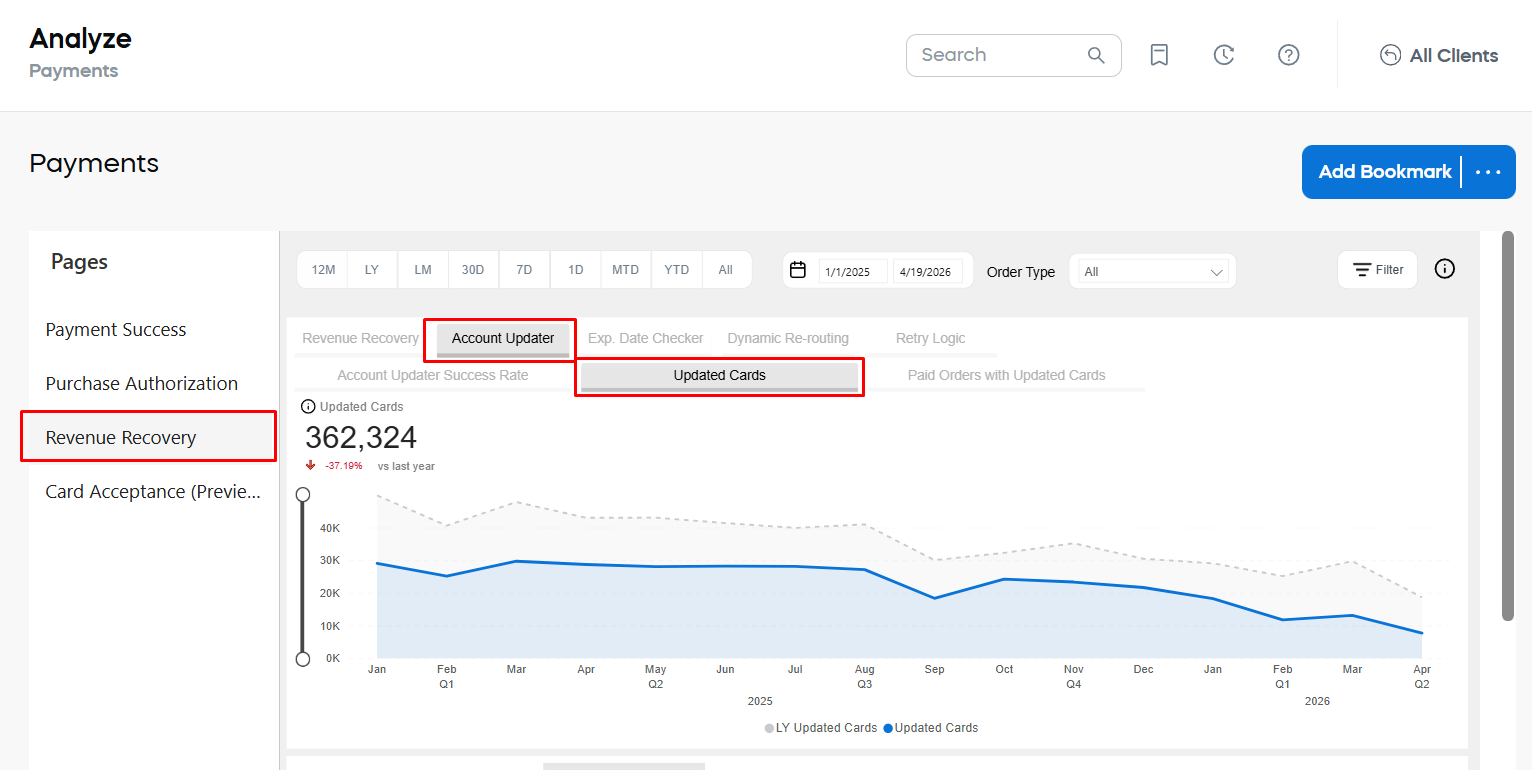
Report structure
Most reports on the dashboard follow the same structure:
- A main report: Displays the selected metric for the current reporting period in a trend chart. In most cases, it also shows the same period last year for comparison. Depending on the report, the main report can also include additional KPI values, such as recovery rate, uplift, or declined orders.
- A [Metric] by section: Lets you analyze the same metric from a different perspective by selecting a dimension, such as Payment Type, Region, Country, Credit Card Scheme, or Decline Reason. This section is represented as a table that shows the selected metric broken down by the chosen dimension. The table can also include related values, such as revenue, order counts, shares, and year-over-year changes. It can also be accompanied by a chart that provides a visual comparison of the same breakdown. In this case, the dimension selected for the chart is also used for the table.
Filters and controls
The dashboard supports all the standard filtering and sorting tools, including built-in and text-search filters, time-granularity changes, drill-down options, Show as table, Spotlight, and data export. In charts, you can also hover over data points to view details and click chart elements to filter the table below.
The top filter panel is used to define ad hoc settings that are applied immediately to the whole report page.

- Quick date range selectors, such as 12M, LY, LM, 30D, 7D, 1D, MTD, YTD, and All, let you switch quickly between commonly used reporting periods.
- Detailed Date Range: Lets you define a custom reporting period by selecting a specific start date and end date.
- Order Type: Lets you limit the report to a specific order category, such as Initial, One-time, or Renewal.
- Filter panel: Provides additional filtering options, depending on the selected report.
You can filter the data by:
- Currency: USD, EUR, or GBP
- Date Range: Month-day-year
- Order Type: Initial, One-time, or Renewal
- Client: Cleverbridge client name/ID
- Product List: A list of products you select and categorize for a particular purpose. One product can be included in several product lists.
- Product: Name/ID of the product
- Renewal Type: Automatic, manual, or non-recurring
- Renewal Period: Month, year, 2 years, or other
- Payment Type, Subtype: Payment type and subtype used by a customer
- Region, Country: World region as defined by Cleverbridge and billing country
- B2B/B2C: Indicates whether the product was sold to a business (B2B) or a private customer (B2C)
- Interval: Subscription interval number. See Subscription Interval Number in Subscription statuses and update options.
Applied filters are displayed above the report area and can be removed individually. 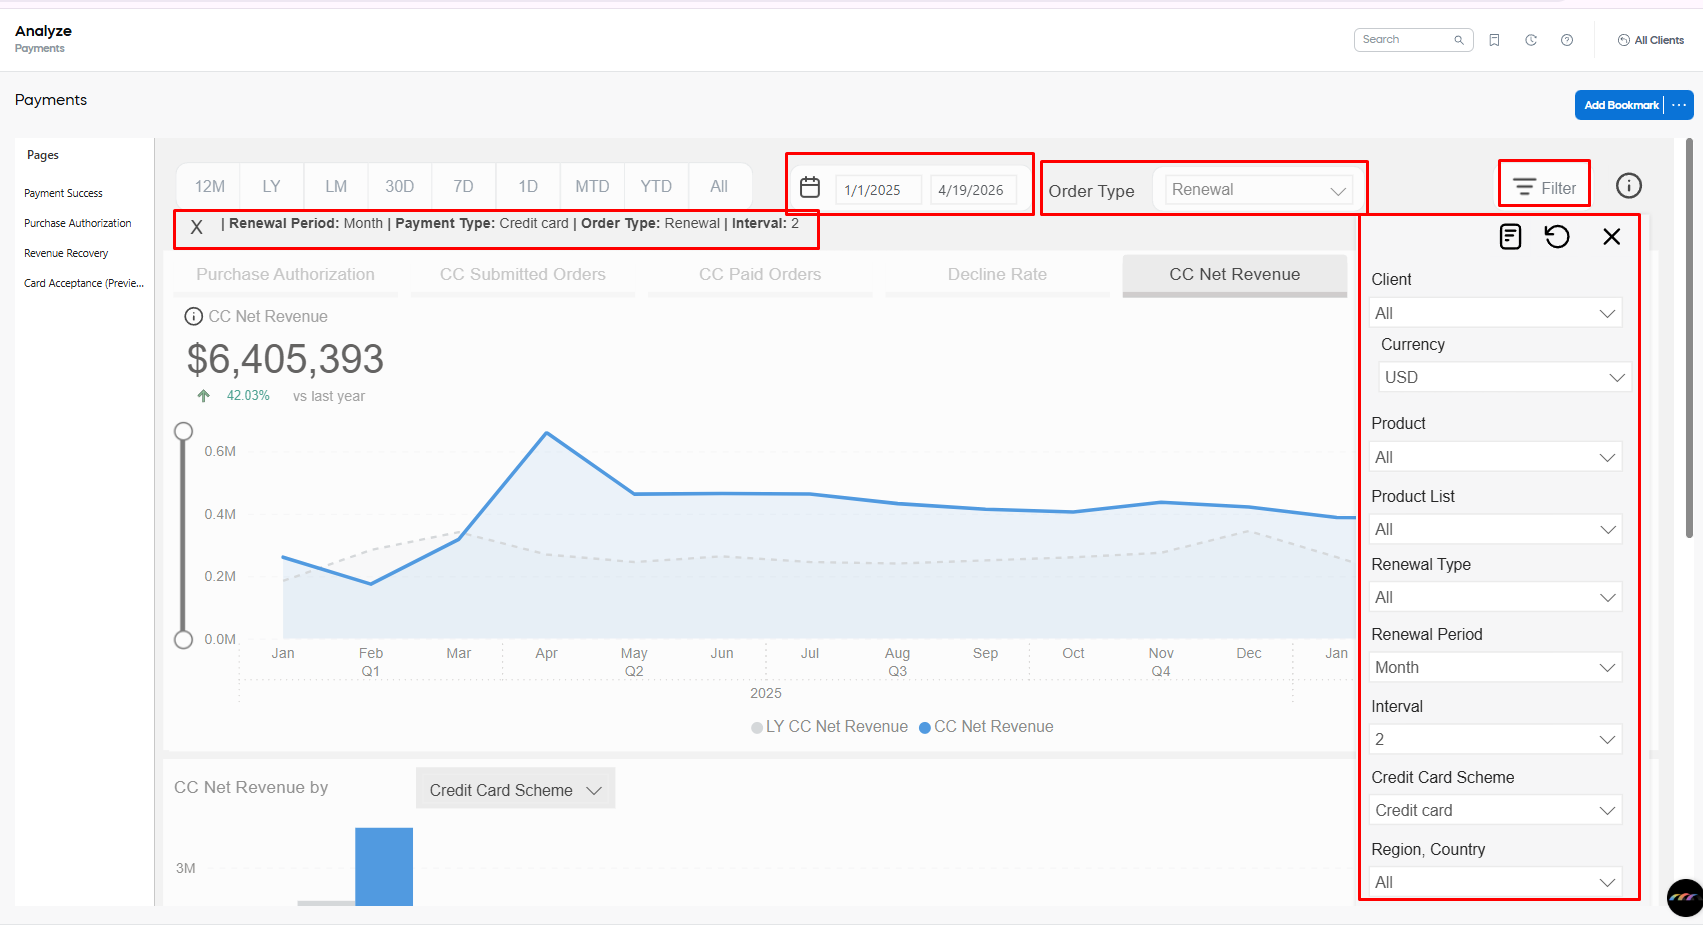
Detailed report descriptions
Payment Success page
Include orders blocked before payment: Determines whether orders blocked before reaching payment are included in the denominator of the Payment Success Rate.
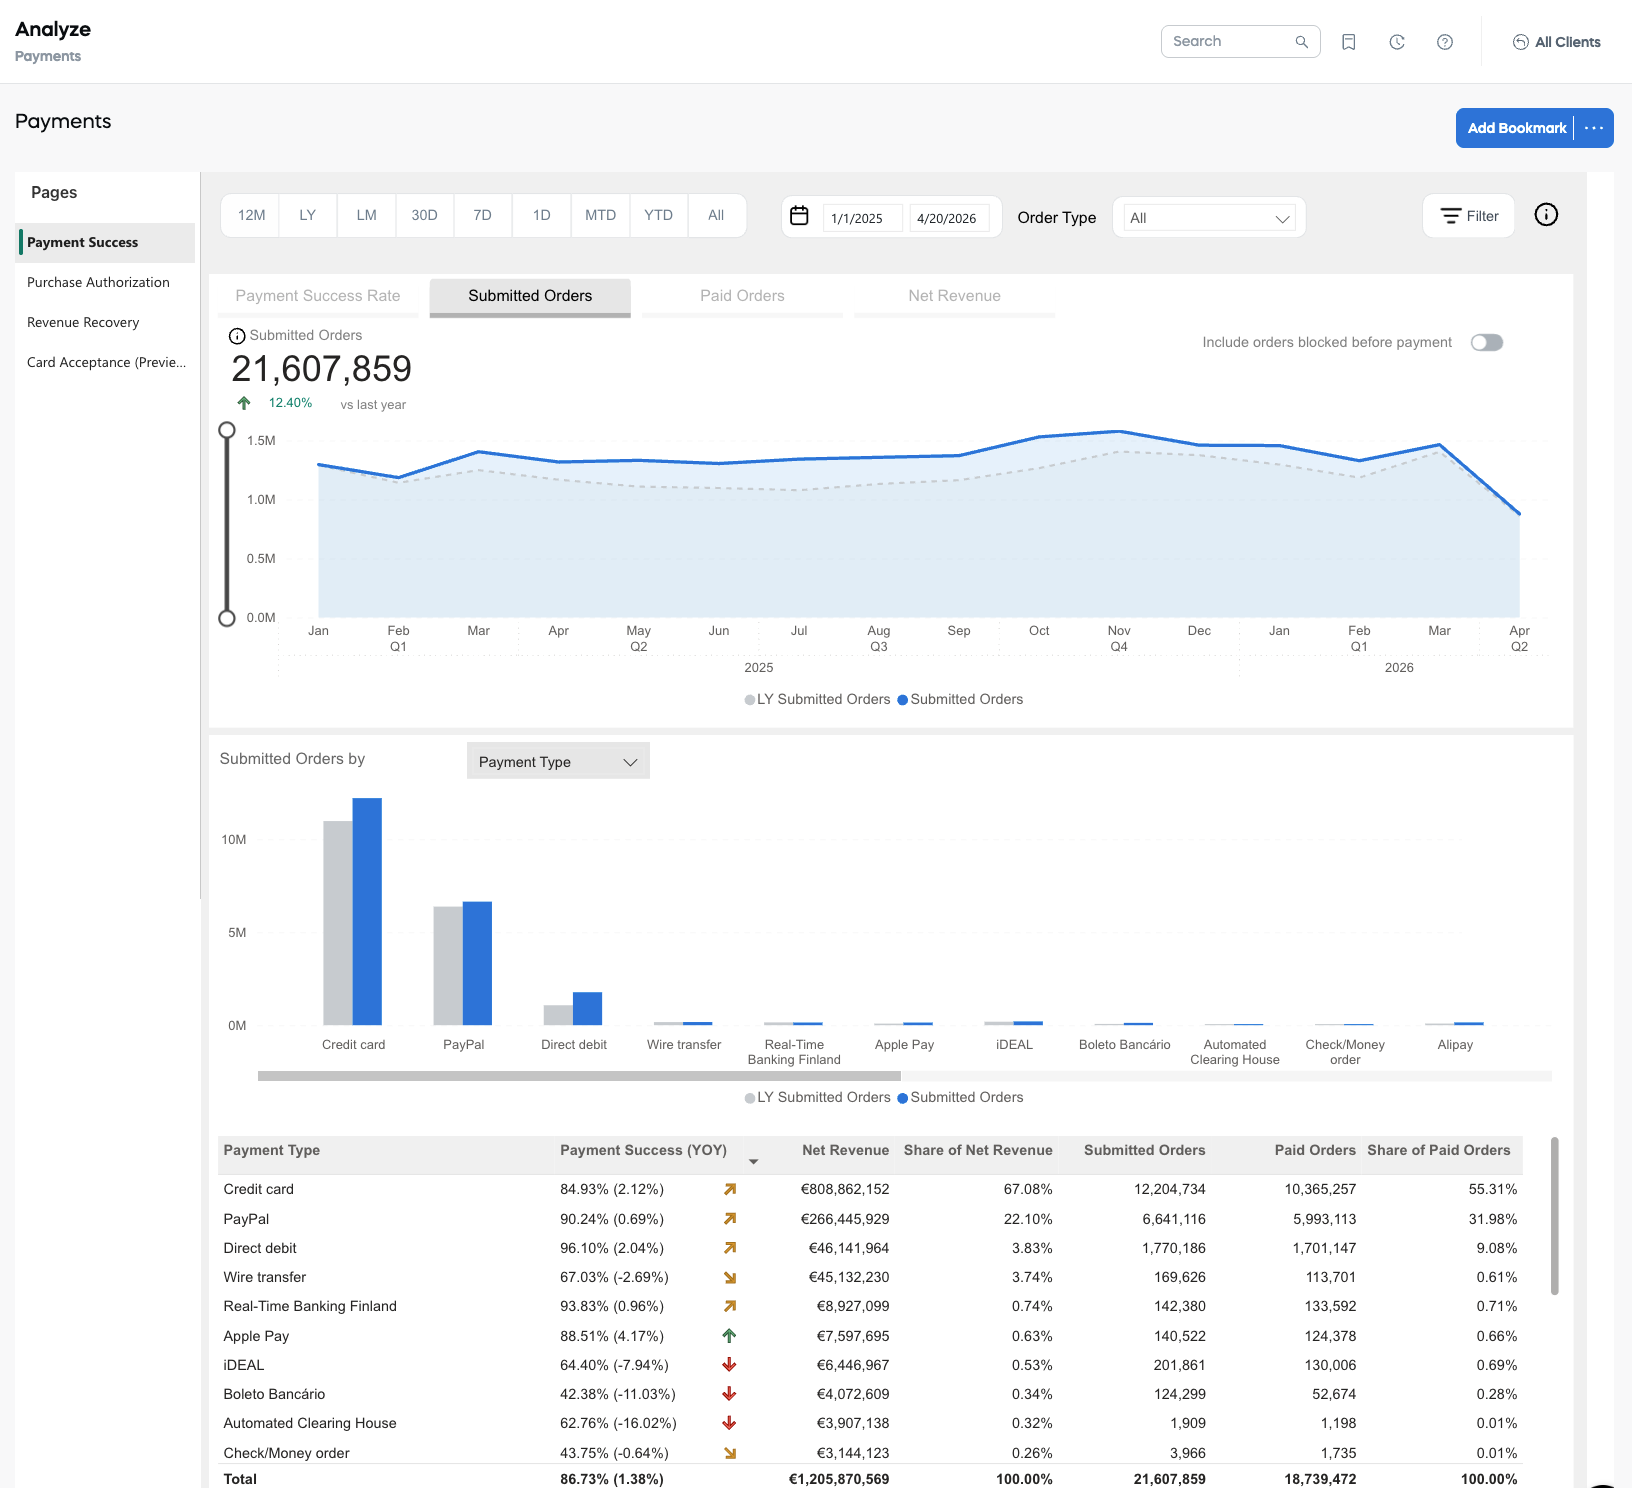
All reports on the Payment Success page have the Include orders blocked before payment toggle. This setting determines whether orders blocked before reaching payment are included in the denominator of the Payment Success Rate and in related metrics such as Submitted Orders:
- When the toggle is enabled, blocked orders are counted as part of the submitted order volume.
- When the toggle is disabled, only orders that reached the payment stage are included.
Payment Success Rate
Payment Success Rate is the percentage of submitted orders that resulted in a successful payment, based on the current Include orders blocked before payment setting. Successfully paid orders remain included even if they were later refunded or charged back.
This metric helps you understand how efficiently submitted orders turn into completed payments and whether payment-related issues are affecting checkout performance.
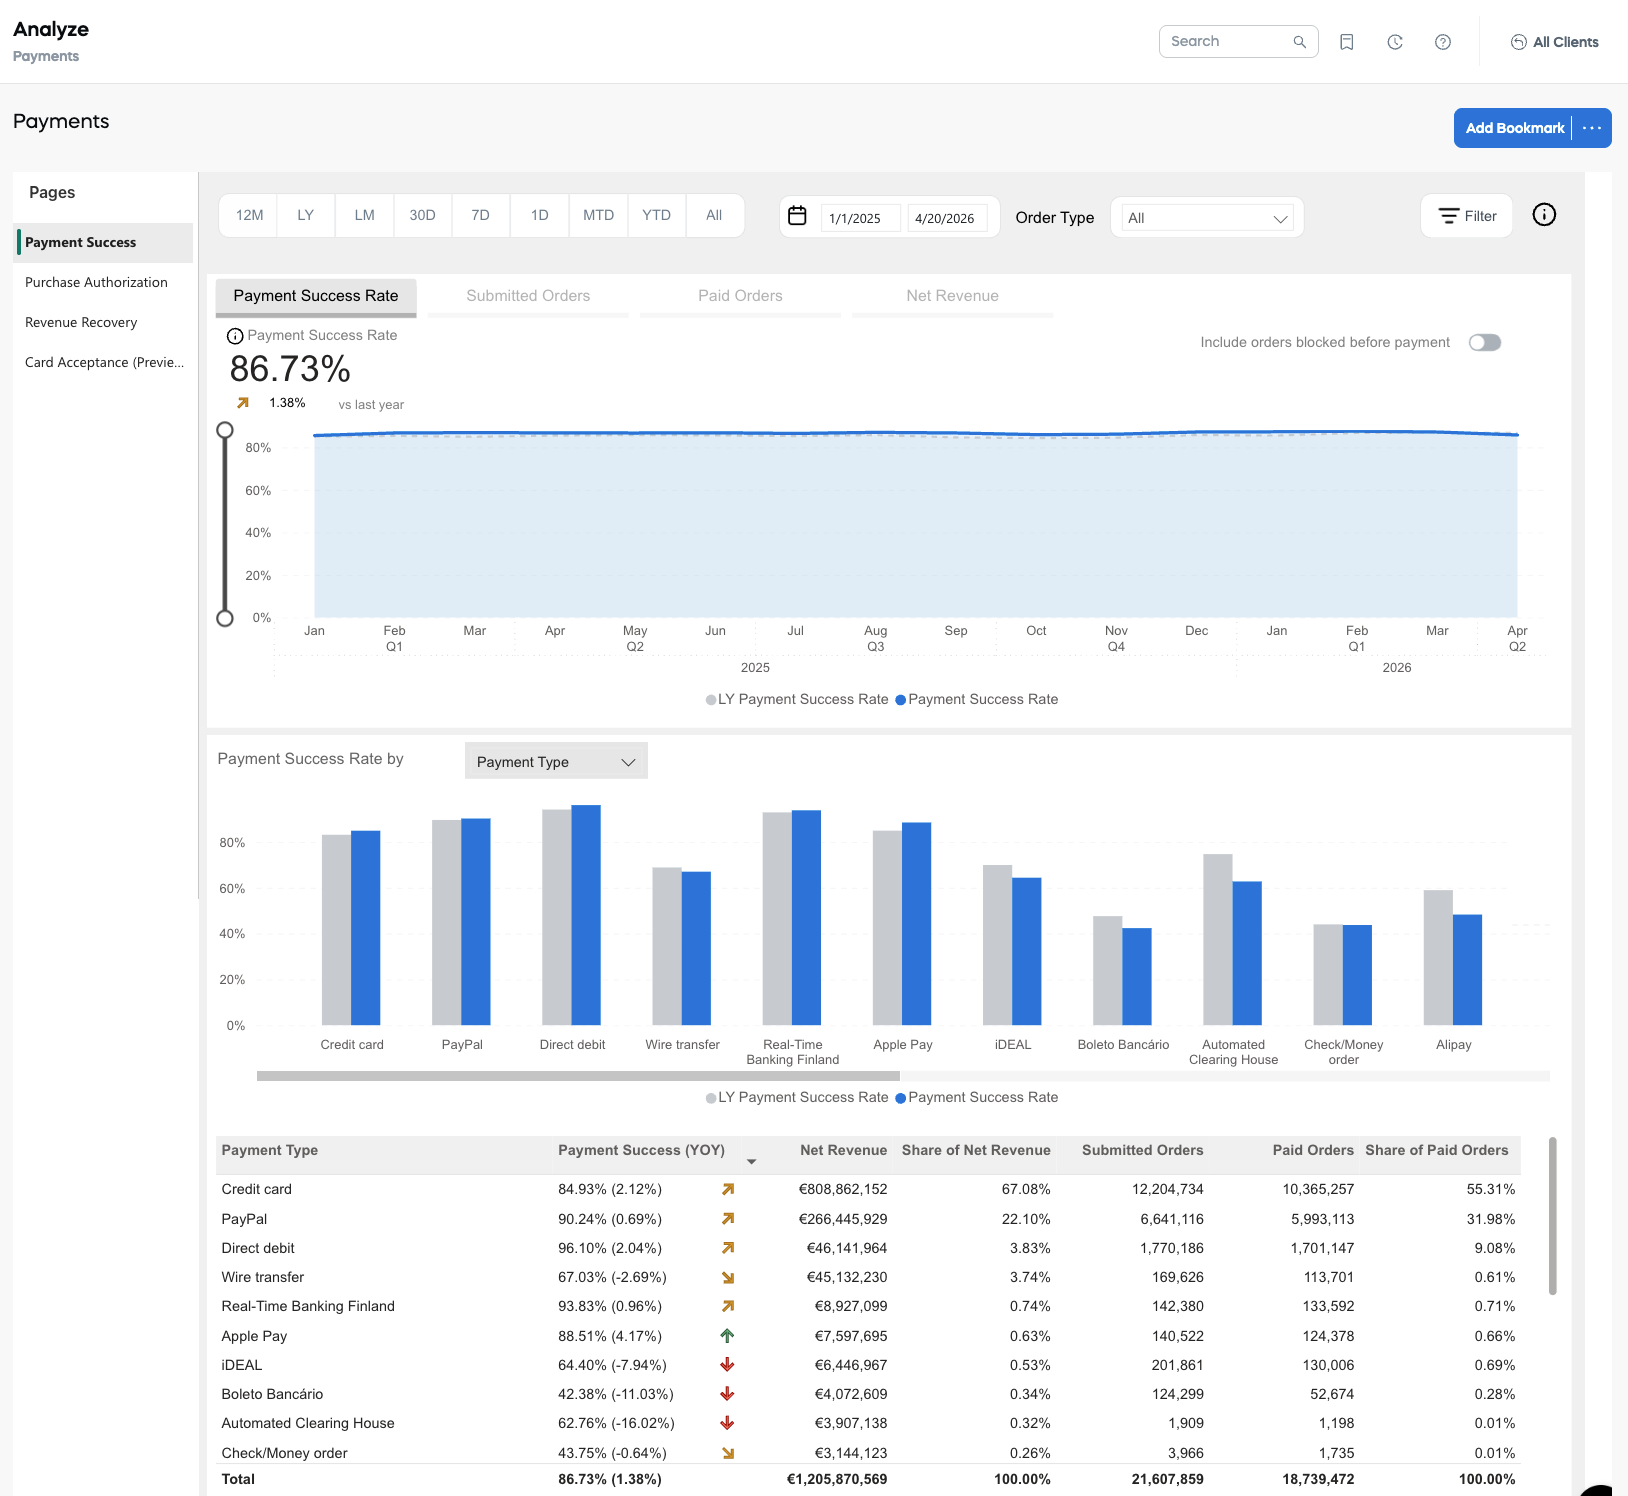
Submitted Orders
Submitted Orders represent successfully created orders for which payment details were received by Cleverbridge. The metric values depend on the current Include orders blocked before payment setting. Orders remain included even if they were later refunded or charged back.
Paid Orders
Paid orders are orders that have been successfully processed, with payment received and product delivery information dispatched. Successfully paid orders also include those where a refund or chargeback was processed after the payment. 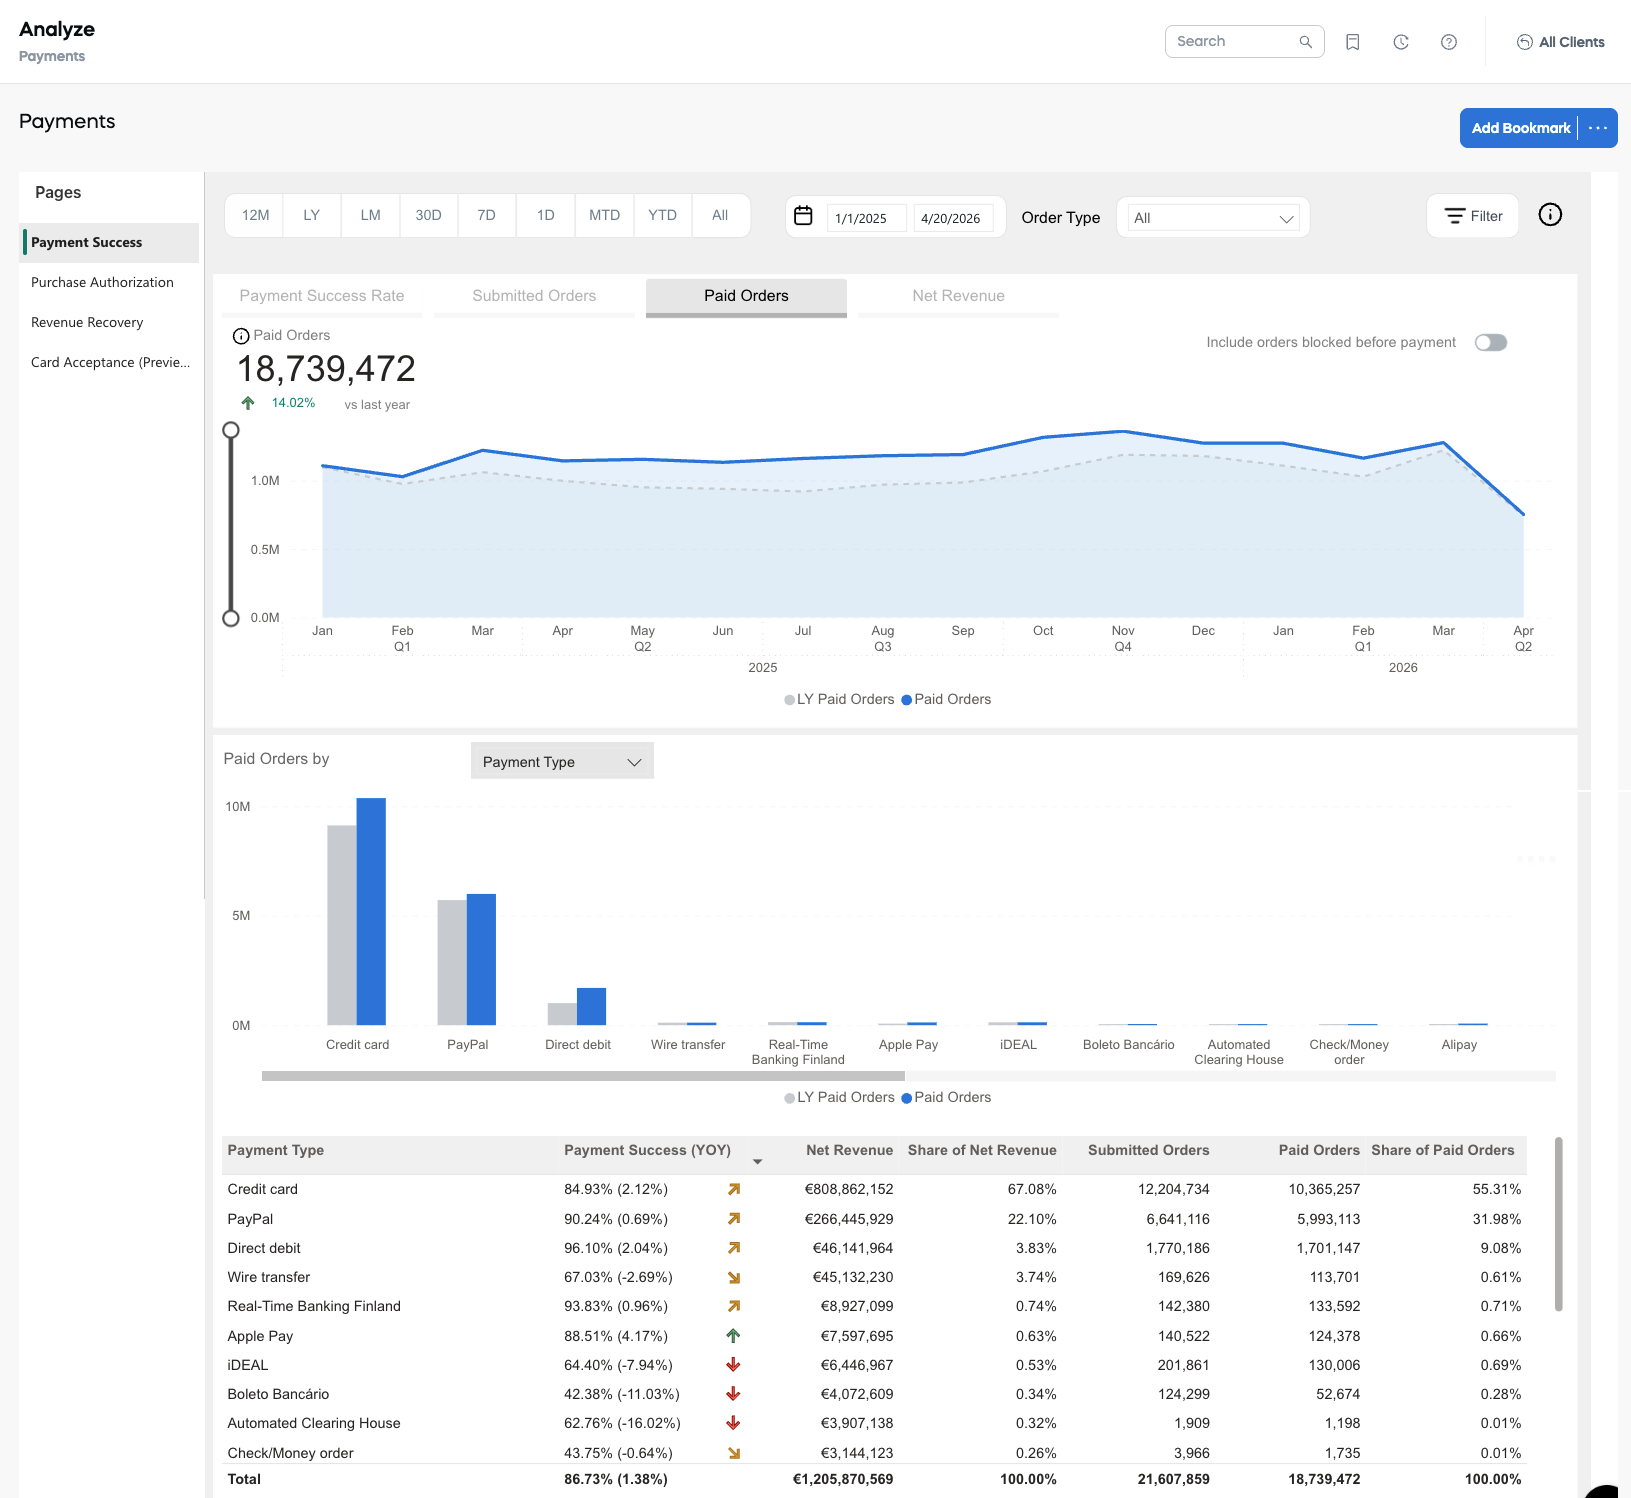
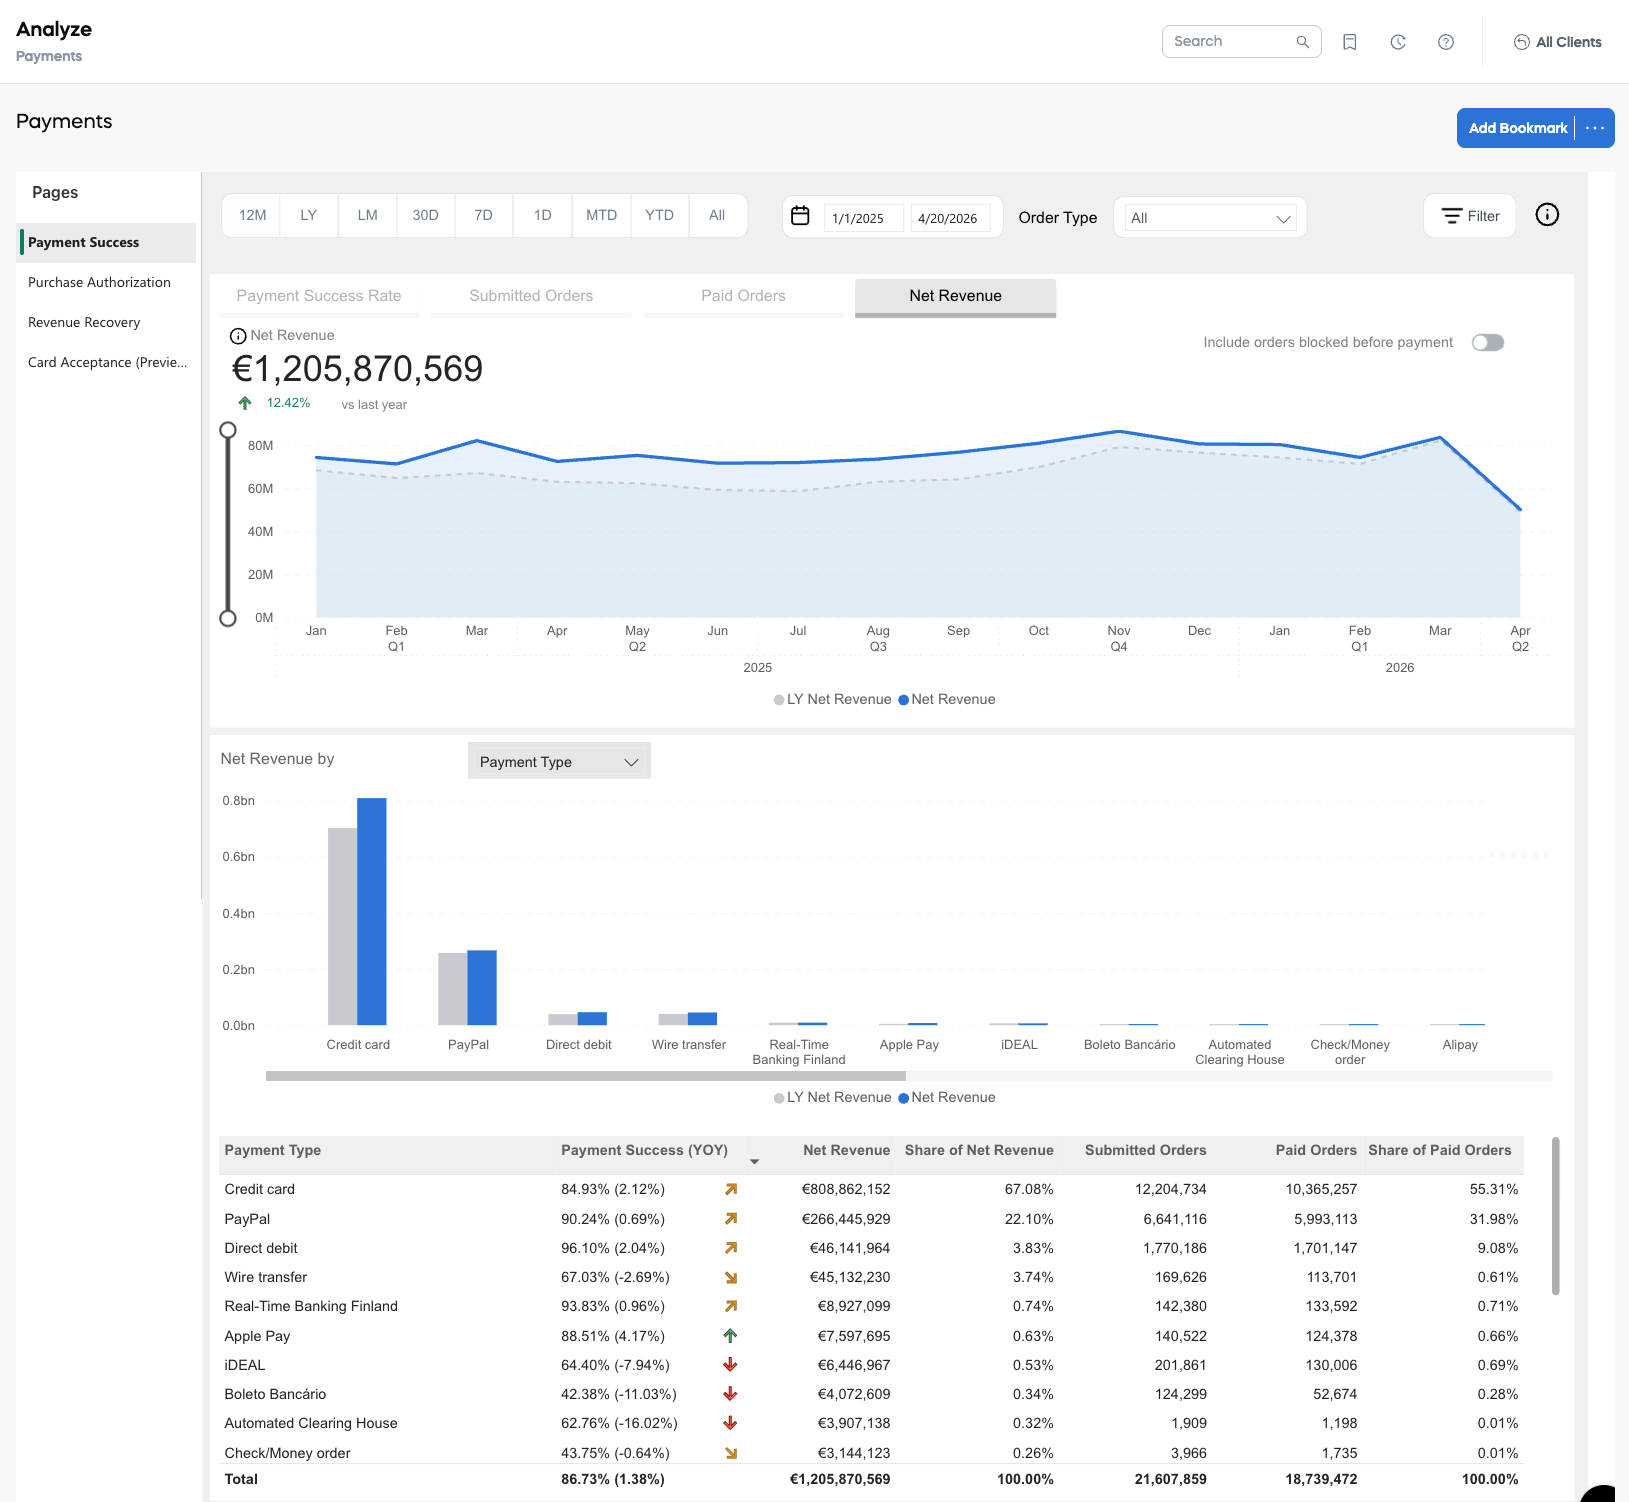
Net Revenue
Net revenue represents the amount generated by paid orders, calculated based on the exchange rate at the time of the transaction. All discounts and shipping costs are subtracted, while Cleverbridge fees and affiliate commissions are included.
If a chargeback or refund occurs, the net revenue amount is reduced by the corresponding order amount.
Purchase Authorization page
The Purchase Authorization page includes information on purchase authorization rates, submitted orders, paid orders, and net revenue, along with historical data for comparison.
Purchase Authorization Rate
The Purchase Authorization Rate measures the number of successfully paid orders divided by all submitted orders. Successfully paid orders include those where a refund or chargeback was processed after the payment.
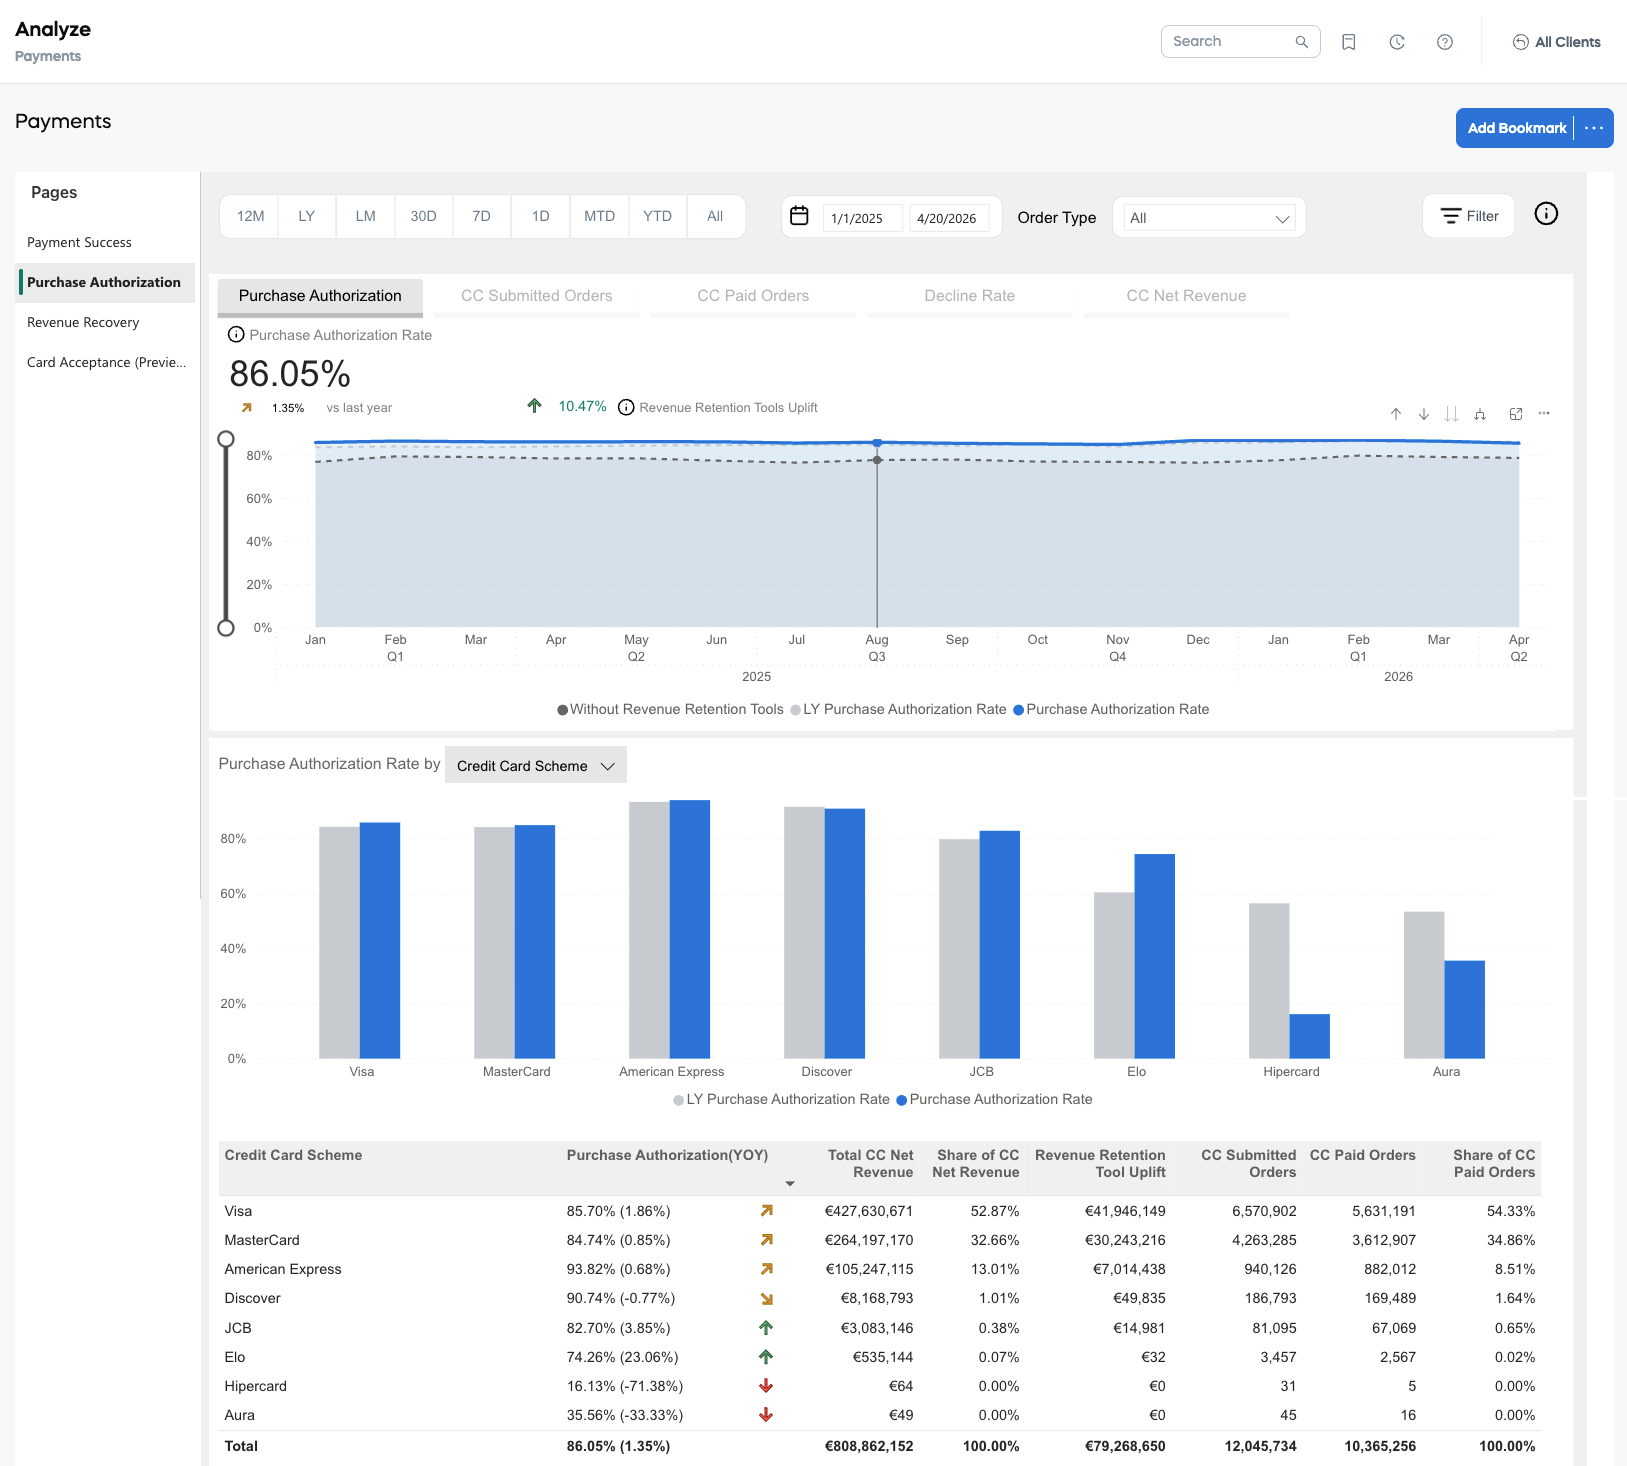
A purchase success rate of 100% would indicate that out of 100 incoming orders, 100 led to a successful order that at some point switched to the Paid status. A purchase success rate of 50% therefore would mean that out of 100 incoming orders, 50 were successfully processed and paid at some point, whereas the other half would not have been successful (for example, when the credit card was declined by a card issuer).
The Purchase Authorization Rate graph displays the following data:
- Purchase Authorization Rate for the selected period and the same period last year
- Revenue Retention Tools Uplift, which is a percentage increase in revenue or orders achieved by leveraging Cleverbridge retention tools such as Account Updates, Expiration Date Checker, Dynamic Re-routing, and Automatic Retry.
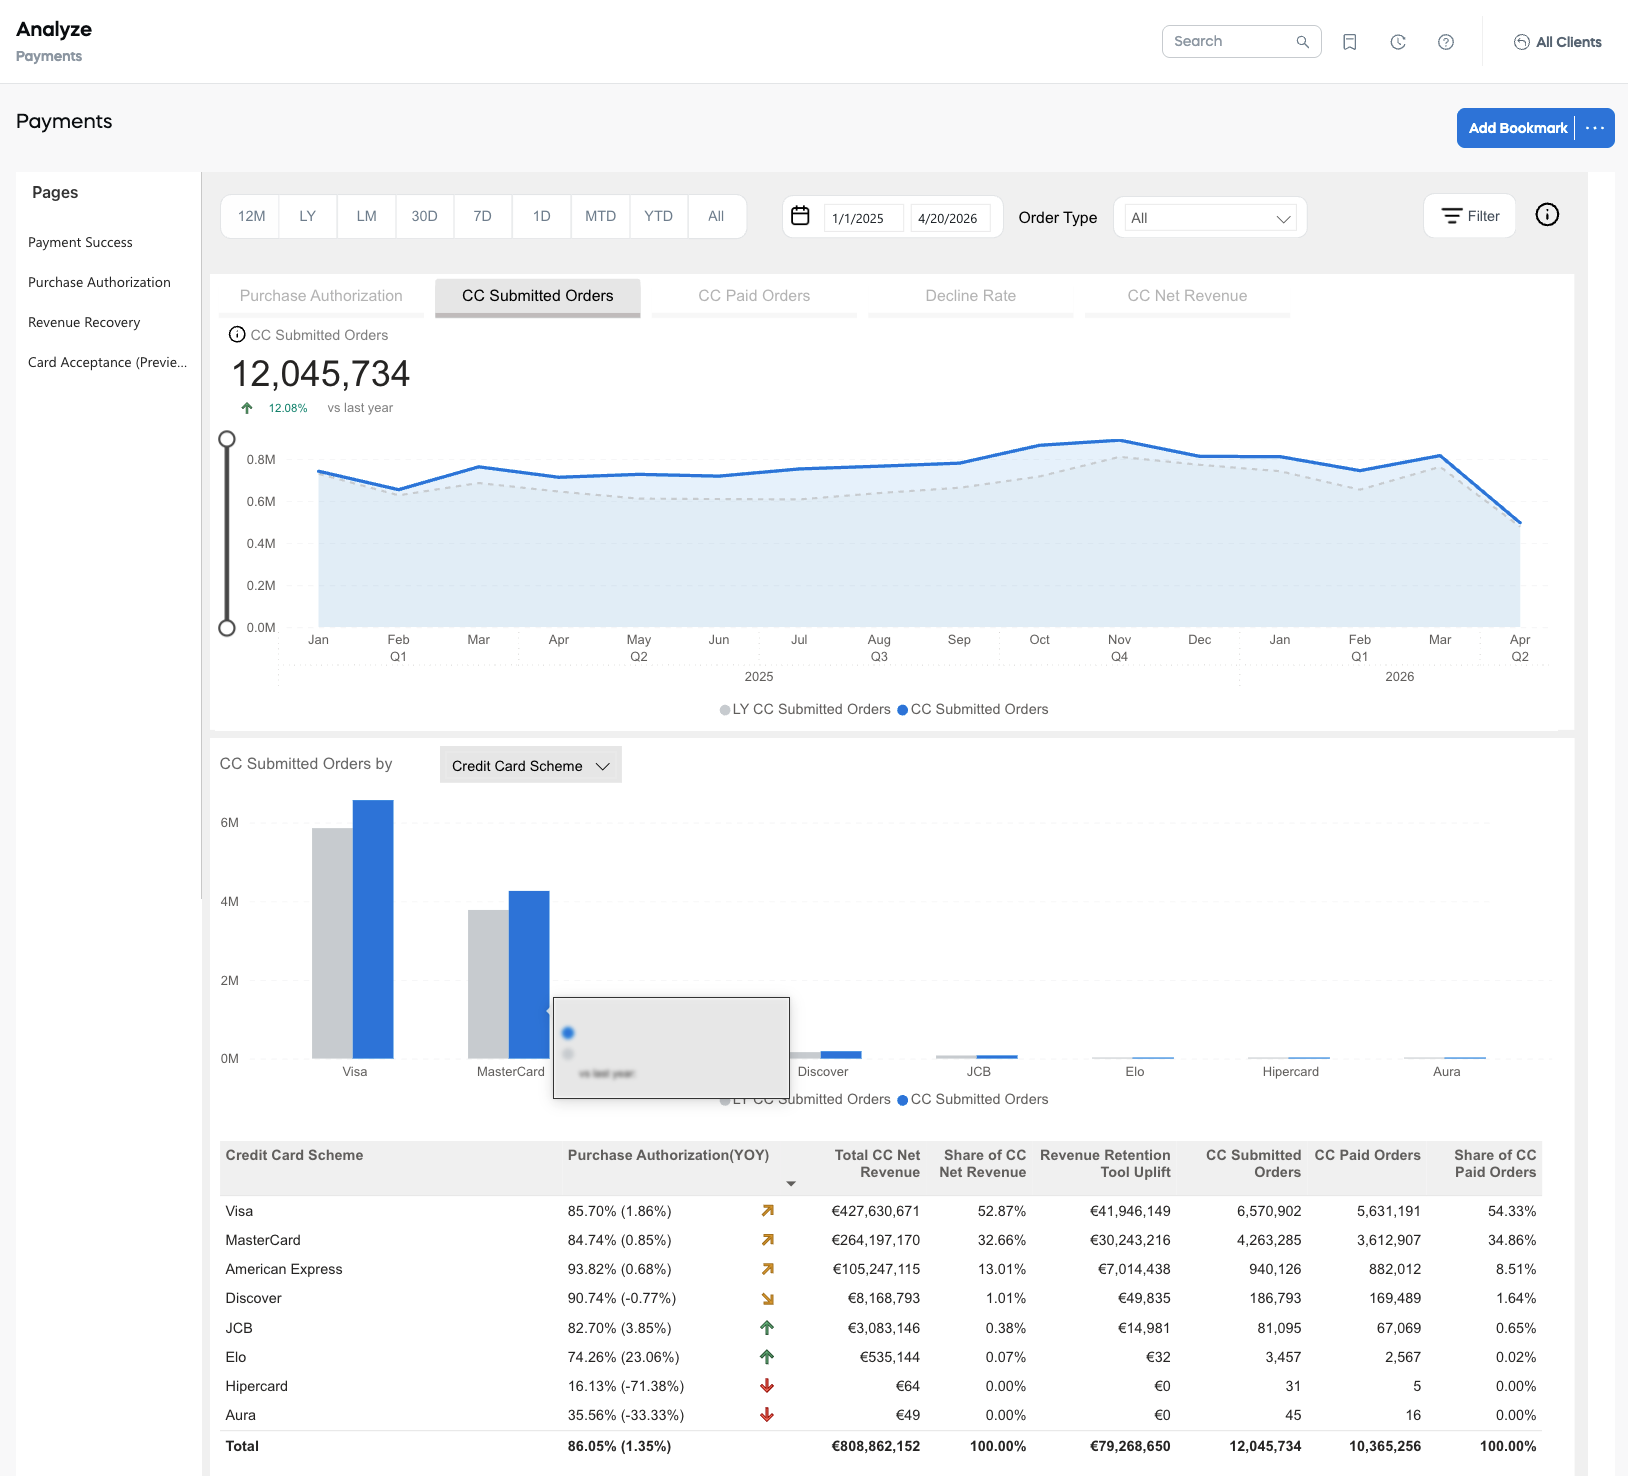
CC Submitted Orders
Number of credit card orders that have been submitted to our PSPs for authorization. Orders that have been blocked for fraud or export compliance and orders that did not pass 3DS authentication are excluded.
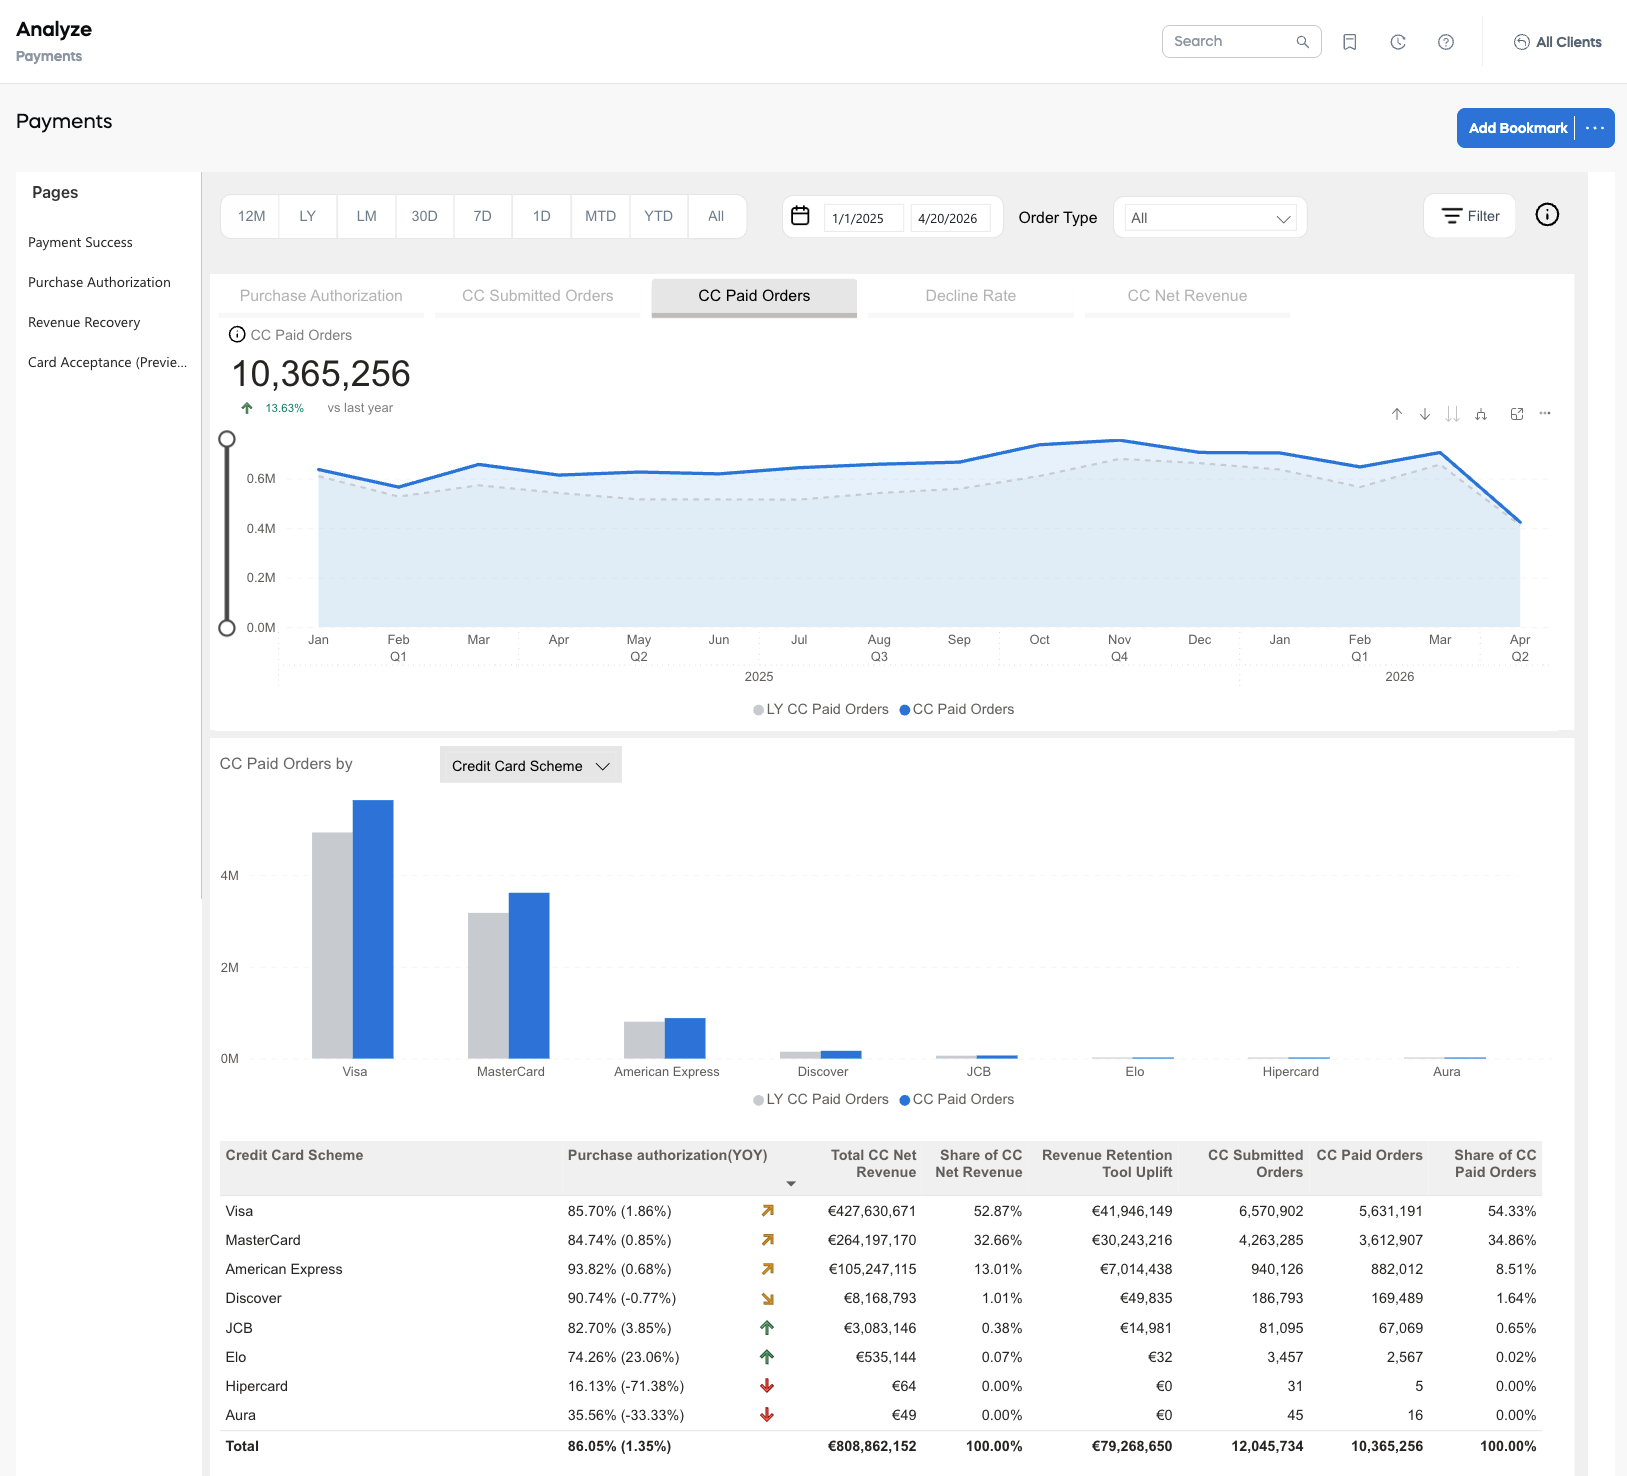
CC Paid Orders
A paid order is an order that has been successfully processed, with payment received and product delivery information dispatched. Successfully paid orders also account for those where a refund or chargeback was processed after the payment.
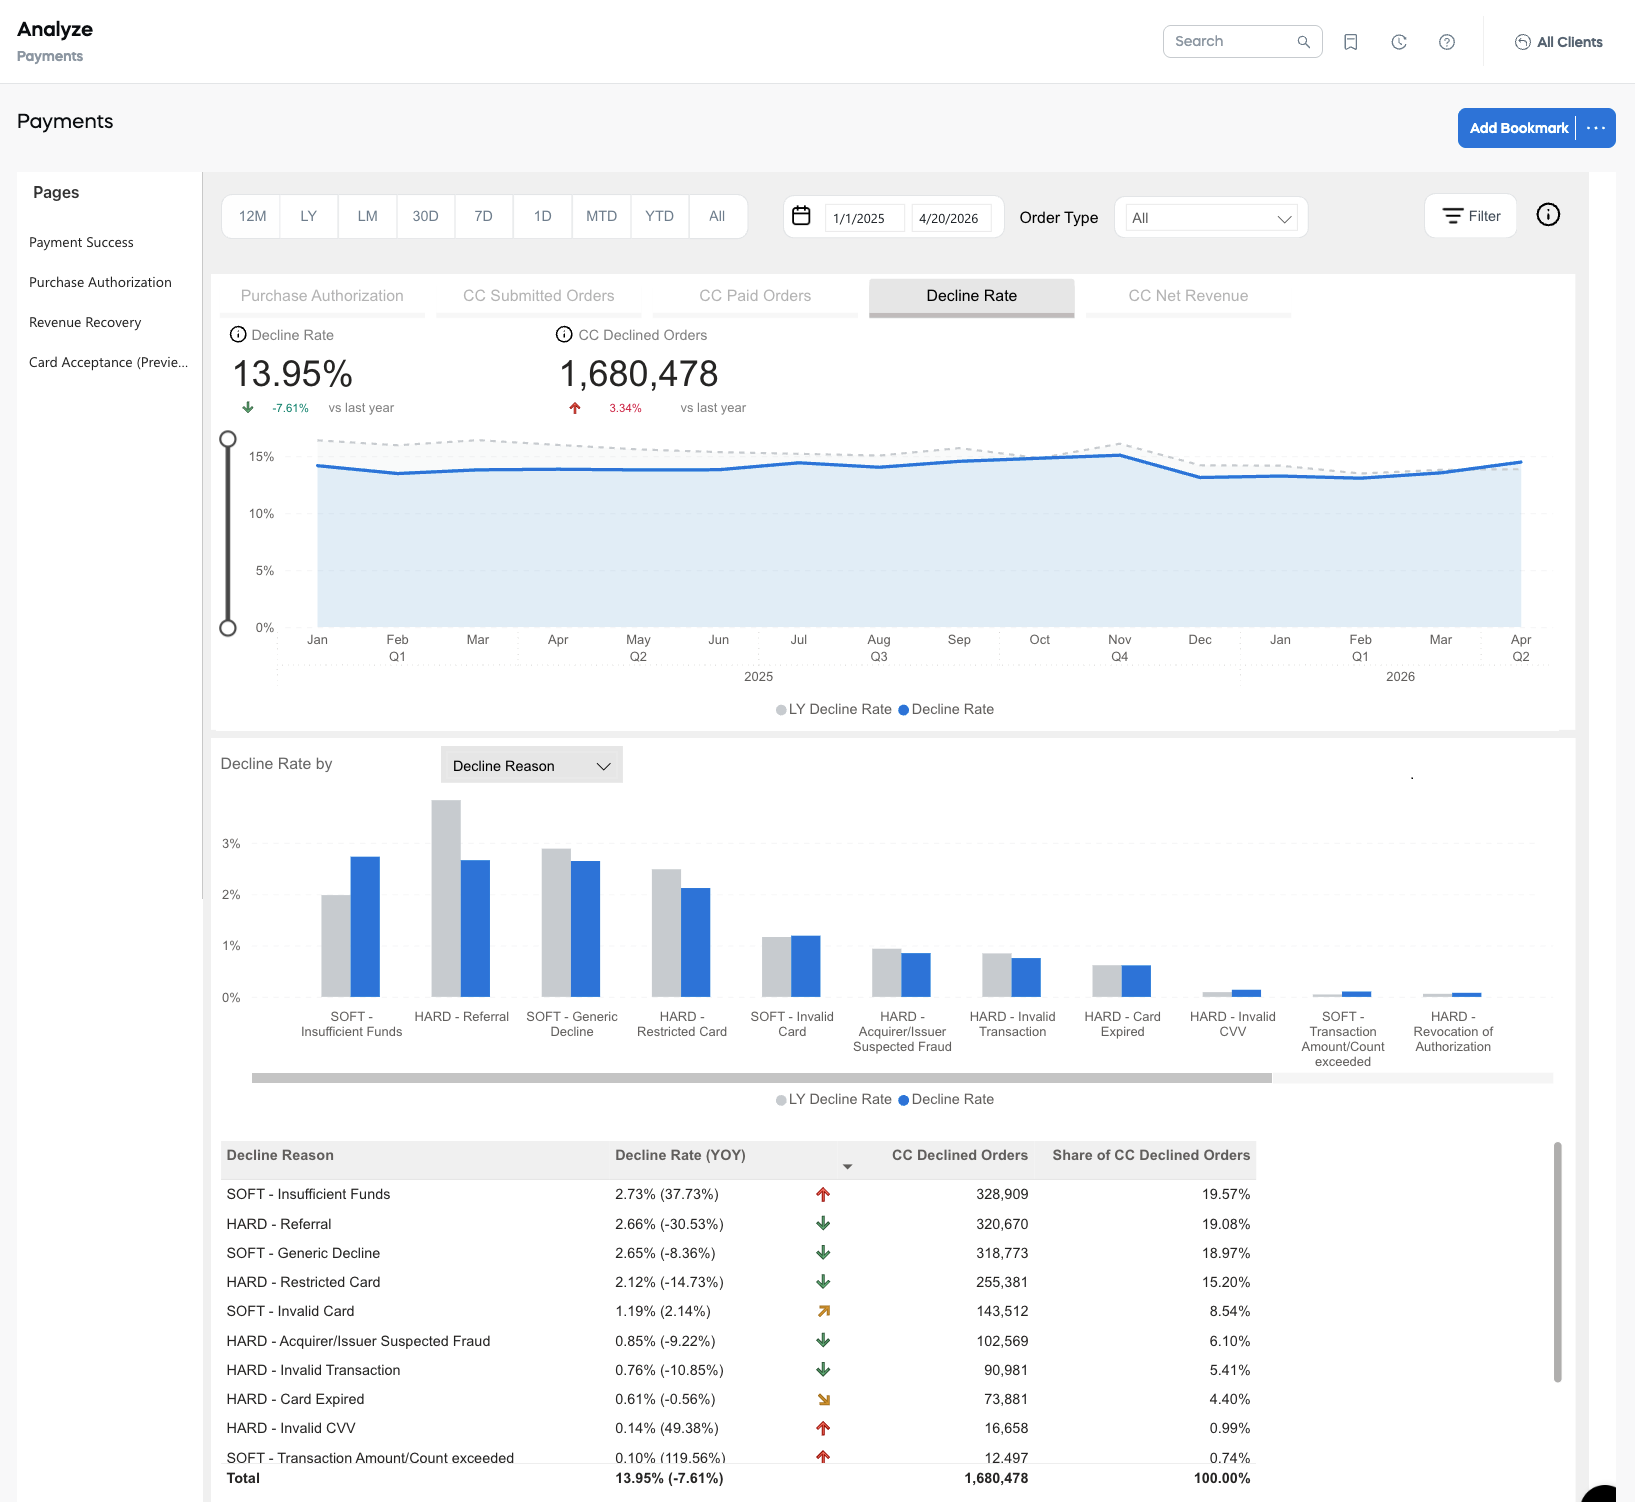
Decline Rate
The Decline Rate represents the percentage of submitted credit card purchases that are declined by card issuers. It is calculated by dividing the number of declined orders by the total number of submitted orders. Since one order may involve multiple transactions with various decline reasons and types, the most recent one is applied.
There are three types of decline:
- Authentication decline, which occurs when transactions are enrolled in 3DS but not yet authorized. The reason for this decline is called Strong Customer Authentication.
- Hard decline, which occurs when the customer's bank refuses the payment for various reasons. Such a decline is permanent and not recoverable. Cleverbridge is unable to assist with these declines. Possible reasons include:
- Card Expired: The transaction is declined due to an expired card.
- Acquirer/Issuer Suspected Fraud: The acquirer or issuer suspects the order is fraudulent.
- Restricted Card: The card cannot be used for this payment, possibly due to being reported as stolen or lost.
- Invalid CVV: The provided CVV is incorrect.
- Invalid Transaction: The credit card cannot be processed for various reasons, such as restrictions based on country, currency, business type, or order volume.
- Referral: The credit card is marked as lost, stolen, or invalid by the customer. The customer is advised to enter a new card or contact their bank.
- Revocation of Authorization: The authorization was revoked either by the customer or their bank. The authorization must be represented.
- Soft decline, which occurs when the issuing bank initially approves the card but a payment process issue arises. Soft declines are temporary. We use revenue retention tools to recover them by addressing the root cause of the initial decline. Possible reasons include:
- Generic Decline: The transaction was declined by the customer's bank. We recommend that the customer contact their bank for further assistance or try using a different payment option.
- Insufficient Funds: The purchase is unsuccessful due to insufficient funds in the customer's account. We recommend that the customer ensure their account has sufficient funds before attempting another transaction.
- Transaction Amount/Count Exceeded: The transaction was declined as it exceeds the balance, credit limit, or transaction amount associated with the customer's card. We recommend that the customer review their limit or consider an alternative payment option.
- Invalid card: The card or the associated account is invalid. We recommend that the customer review the card details or try a different payment option.
- Connector/Acquirer Currently Down: The transaction couldn't be processed as the corresponding connector or acquirer is temporarily unavailable. We recommend that the customer try again later or choose an alternative payment option.
CC Net Revenue
Net Revenue reflects the amount generated by paid orders for credit cards, based on the exchange rate at the time of the transaction. All discounts and shipping costs are subtracted, while Cleverbridge fees and affiliate commissions are included. 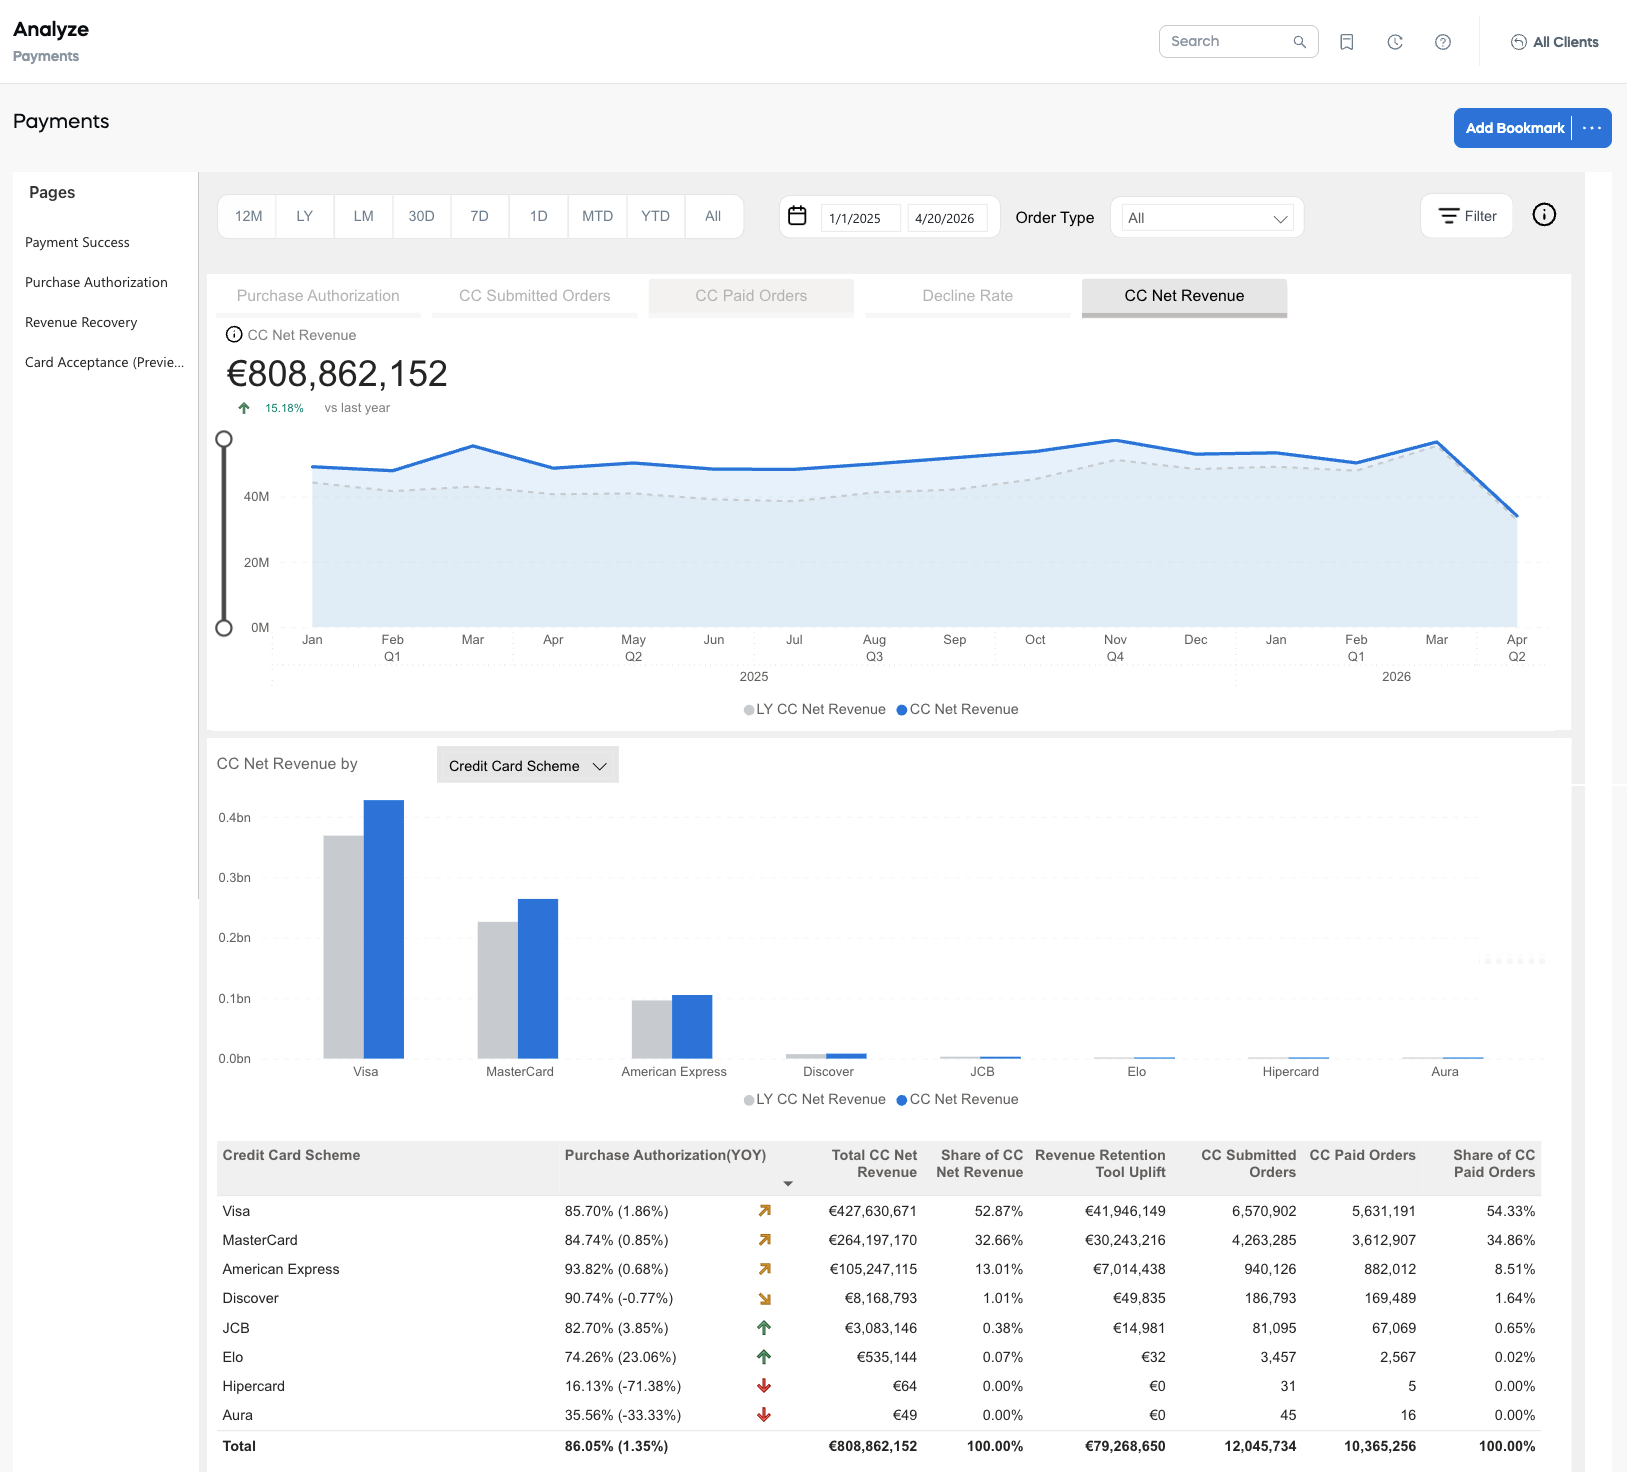
If a chargeback or refund occurs, the net revenue amount is reduced by the corresponding order amount.
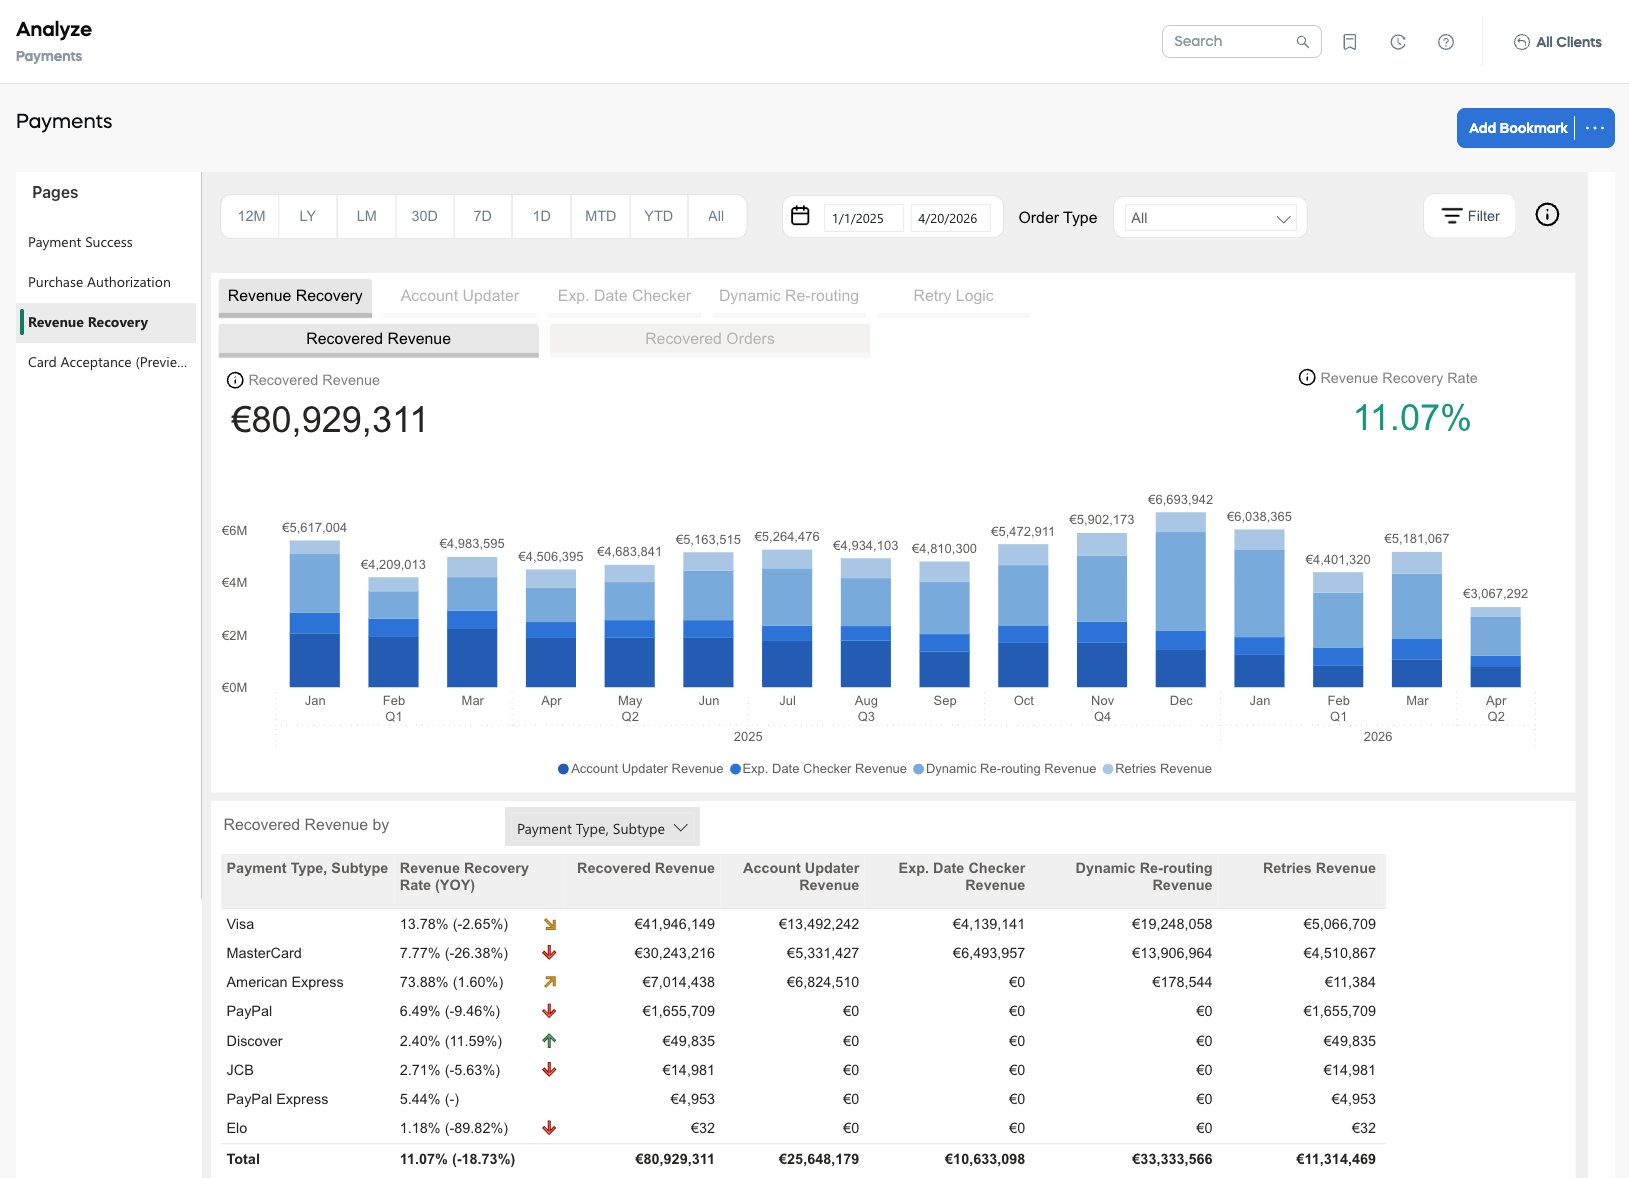
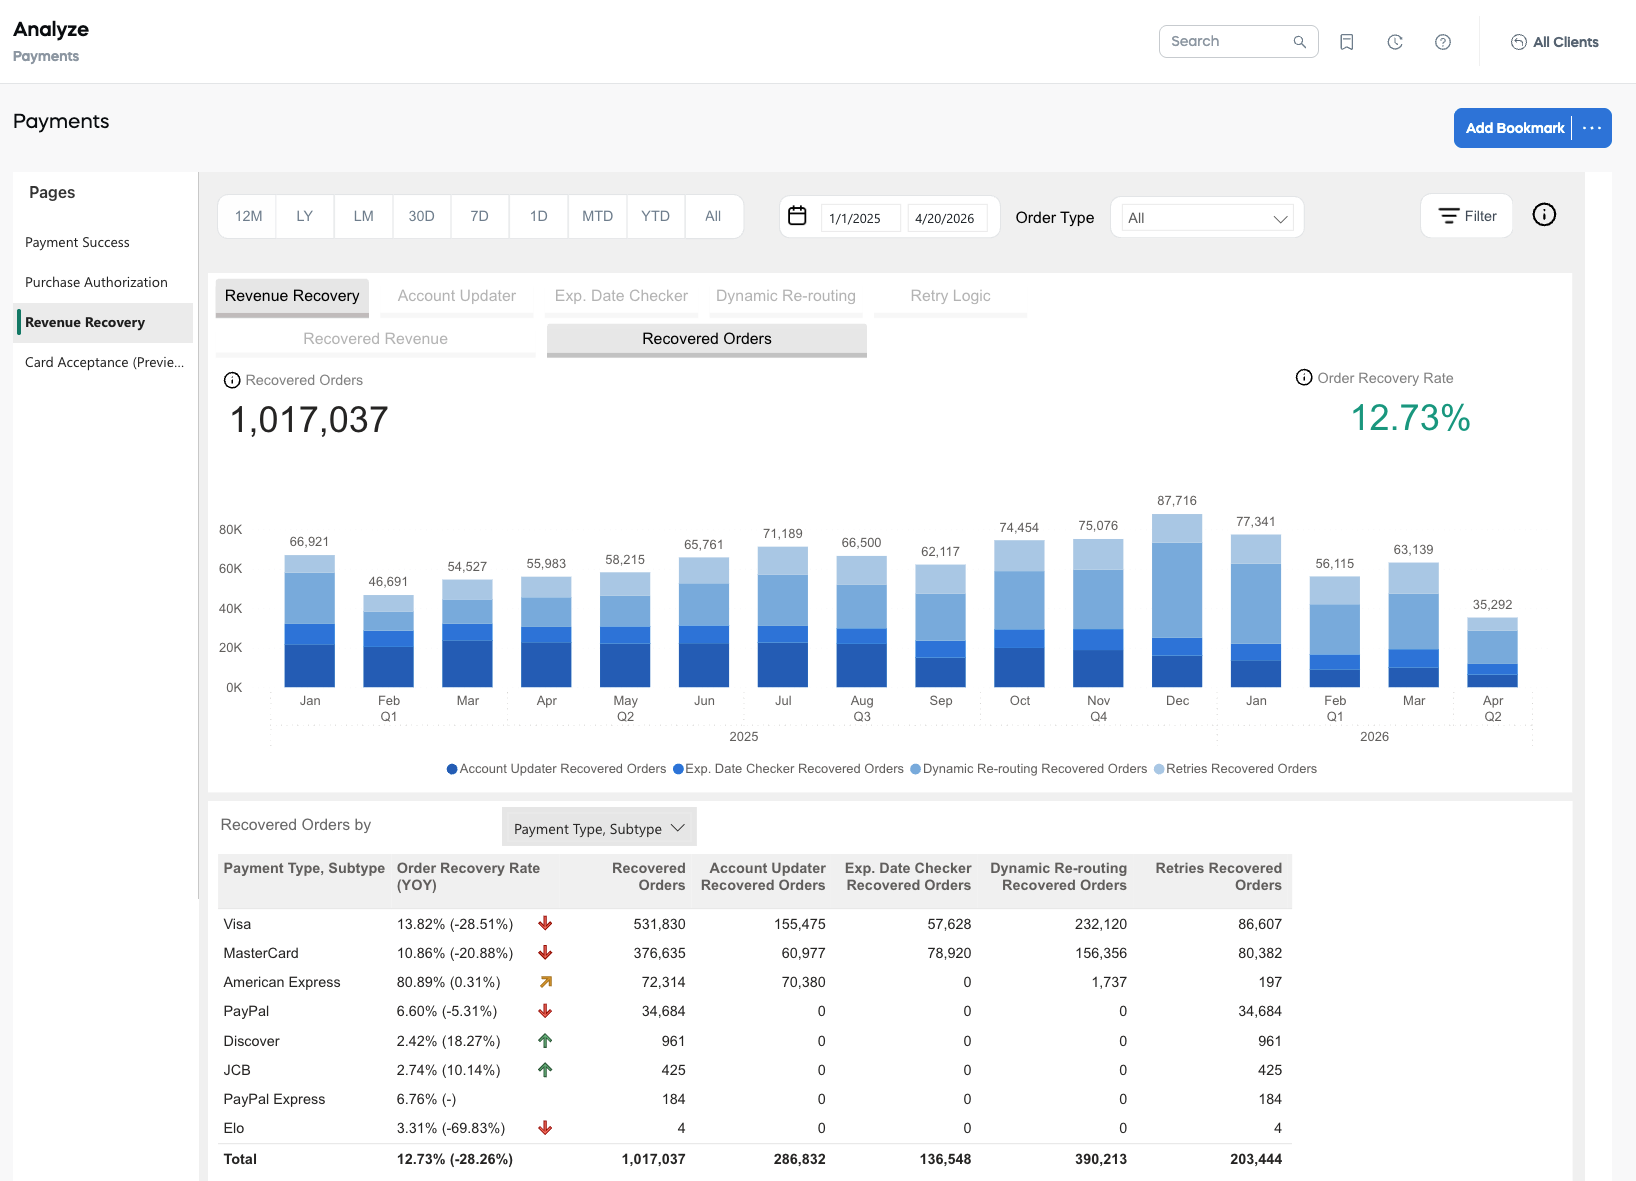
Revenue Recovery page
The Revenue Recovery page displays charts with information on the potential revenue loss prevented by Cleverbridge revenue retention tools. Those tools help you prevent payment failures and revenue churn that could happen due to outdated credit card details.
Revenue Recovery graphs
The Revenue Recovery graphs provide insights into recovered renewal revenue and recovered renewal orders, showcasing data related to revenue generation and the number of orders that were successfully recovered through various mechanisms, such as card updates, expiration date checks, rerouting, and automatic retries.
The Revenue Recovery graphs are:
Recovered Revenue
The Recovered Revenue graph displays the following data:
- Account Updater Revenue: Revenue of orders with updated cards, which could be converted into renewals, during the selected period.
- Exp. Date Checker Revenue: Revenue generated from orders that were successfully renewed after updating their expiration dates using the Expiry Date Checker.
- Dynamic Re-routing Revenue: Revenue derived from orders rerouted and delivered to secondary acquirers due to the initial unsuccessful attempt to deliver them to primary acquirers. Acquirers, in this context, are banks or financial institutions that process credit or debit card payments on behalf of Cleverbridge.
- Retries Revenue: Revenue generated from orders where our retry logic was successfully applied, indicating that we were able to reprocess failed payments after specific intervals. This revenue includes PayPal Retries, as well as Self Service Retries. This retry logic is applied to renewal payments only.
- Partner Retries Revenue: Revenue generated from partner retries—retry attempts that are not initiated by the Cleverbridge retry logic, whether static or dynamic, but instead by a Cleverbridge partner.
Recovered Orders
The Recovered Orders graph displays the following data:
- Account Updater Recovered Orders: Number of orders with updated cards, which could be converted into renewals, during the selected period.
- Exp. Date Checker Recovered Orders: Number of renewals generated from orders that were successfully renewed after updating their expiration dates using the Expiration Date Checker.
- Dynamic Re-routing Recovered Orders: Number of orders rerouted and delivered to secondary acquirers due to the initial unsuccessful attempt to deliver them to primary acquirers. Acquirers, in this context, are banks or financial institutions that process credit or debit card payments on behalf of Cleverbridge.
- Retries Recovered Orders: Number of orders where our retry logic was successfully applied, indicating that we were able to reprocess failed payments after specific intervals. This value includes PayPal Retries, as well as Self Service Retries. This retry logic is applied to renewal payments only.
- Partner Retries Recovered Orders: Number of orders recovered from partner retries—retry attempts that are not initiated by the Cleverbridge retry logic, whether static or dynamic, but instead by a Cleverbridge partner.
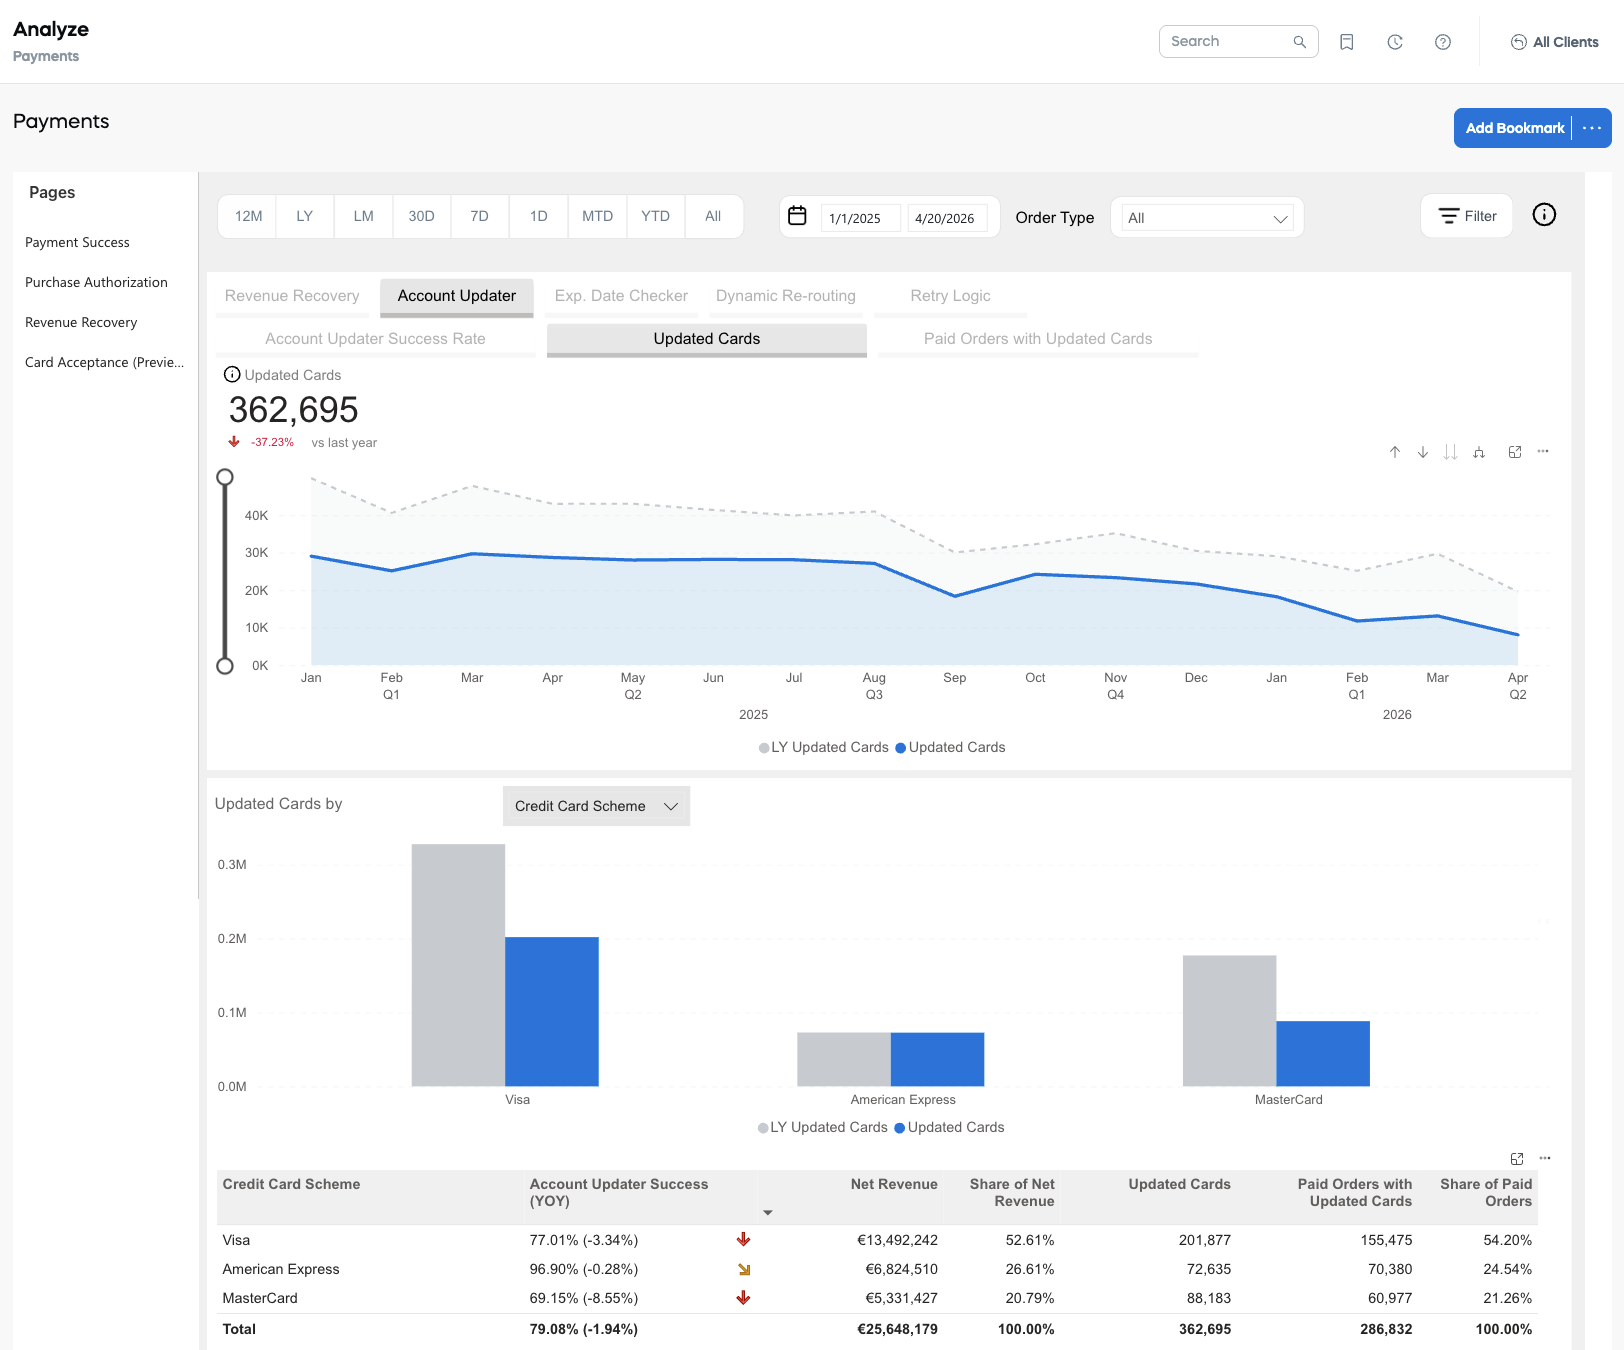
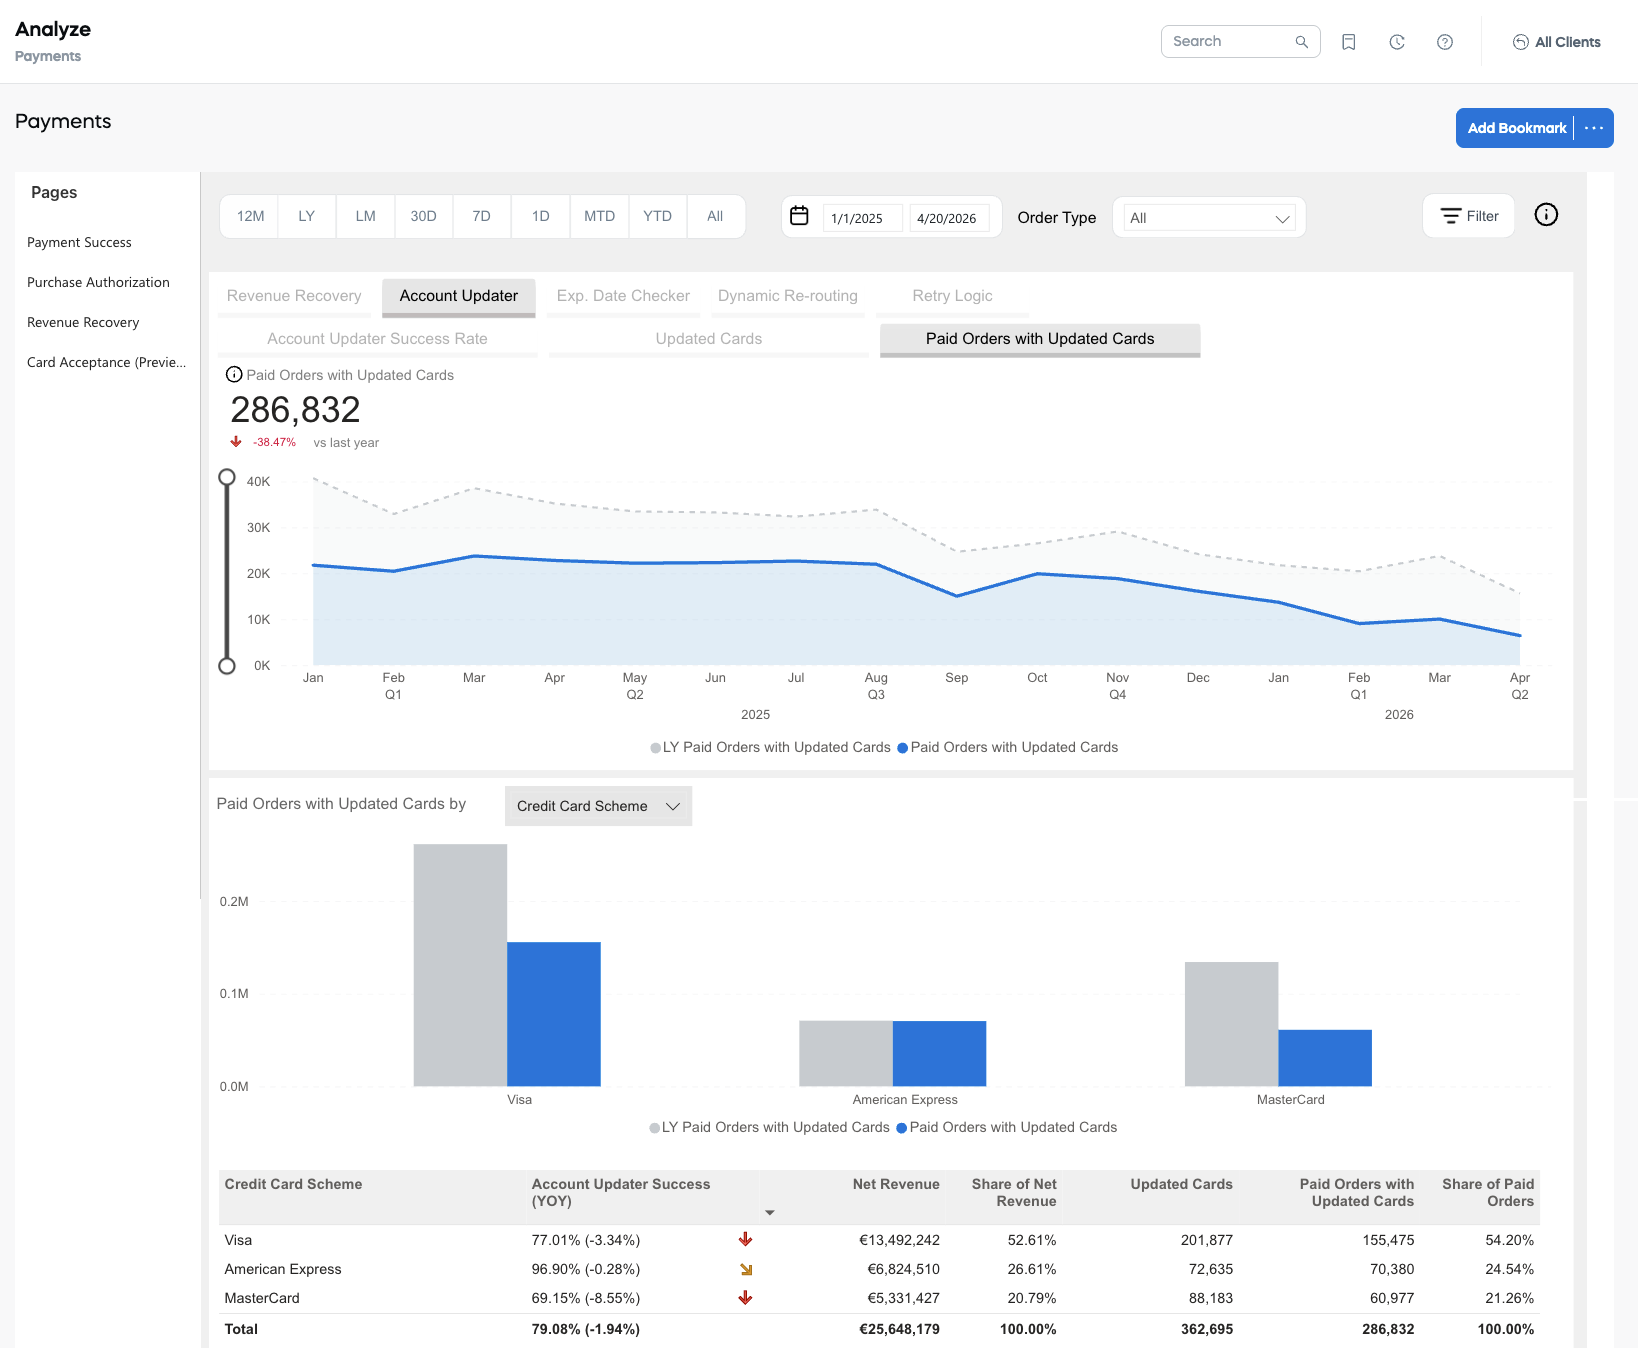
Account Updater graphs
The Account Updater graphs include data on the success rate of cards with successfully paid orders, the number of updated cards, and the number of paid orders associated with those updated cards during the selected period and the same period last year.
The Account Updater graphs are:
Account Updater Success Rate
Percentage of cards with successfully paid orders out of total updated cards during the selected period and the same period last year. 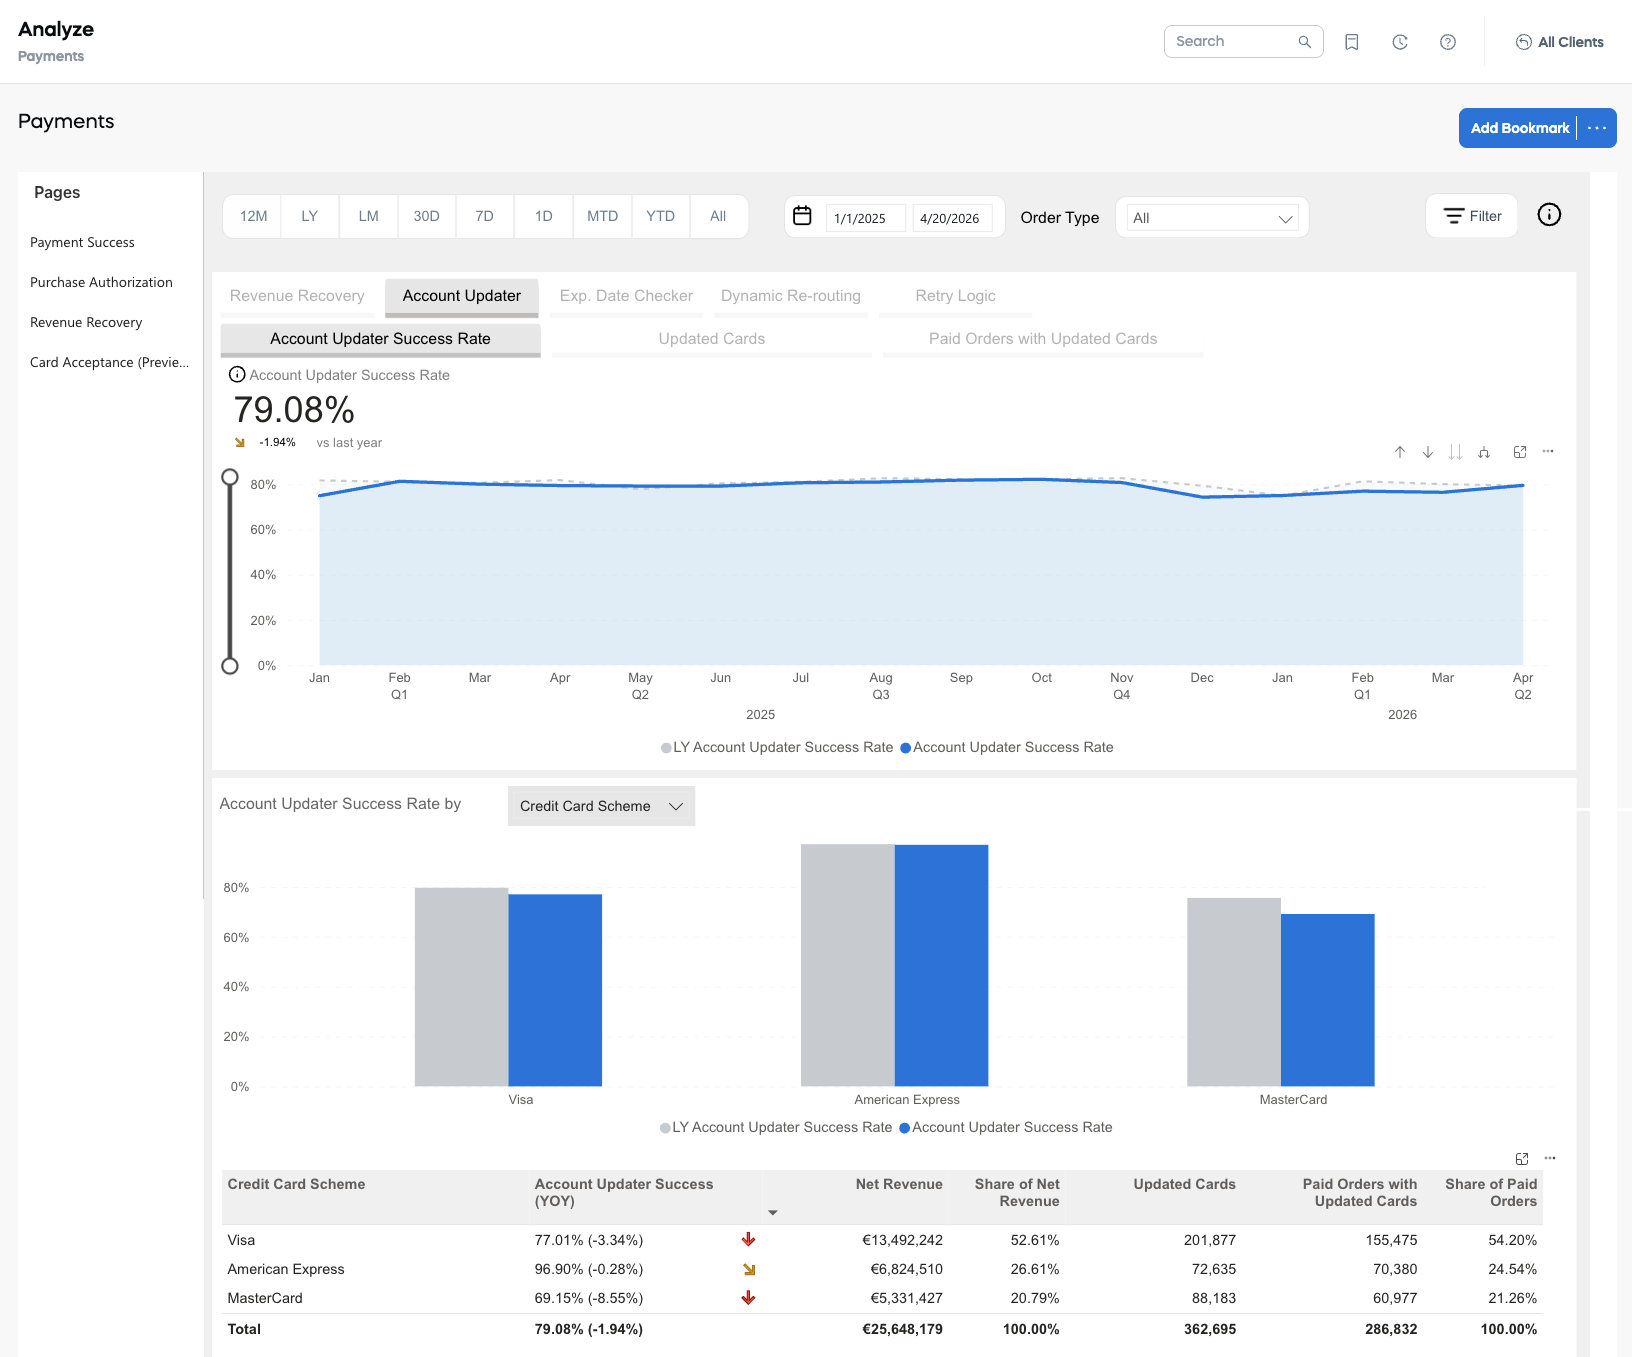
Updated Cards
Number of credit cards, during the selected period and the same period last year, for which renewal details were received from the credit card companies when the Account Updater identified that the cards were due for renewal.
Paid Orders with Updated Cards
Number of orders paid for with credit cards, during the selected period and the same period last year, for which renewal details were received from the credit card companies when the Account Updater identified that the cards were due for renewal.
Exp. Date Checker graphs
The Exp. Date Checker graphs depict the success rate of the Expiration Date Checker in updating and converting expired cards into successful renewals, along with the number of checked expired cards and the corresponding paid orders that resulted in successful renewals during the selected period and the same period last year.
The Exp. Date Checker graphs are:
Exp. Date Checker Success Rate
Shows the percentage of successful Expiry Date Checker renewals for the selected year versus the previous year. 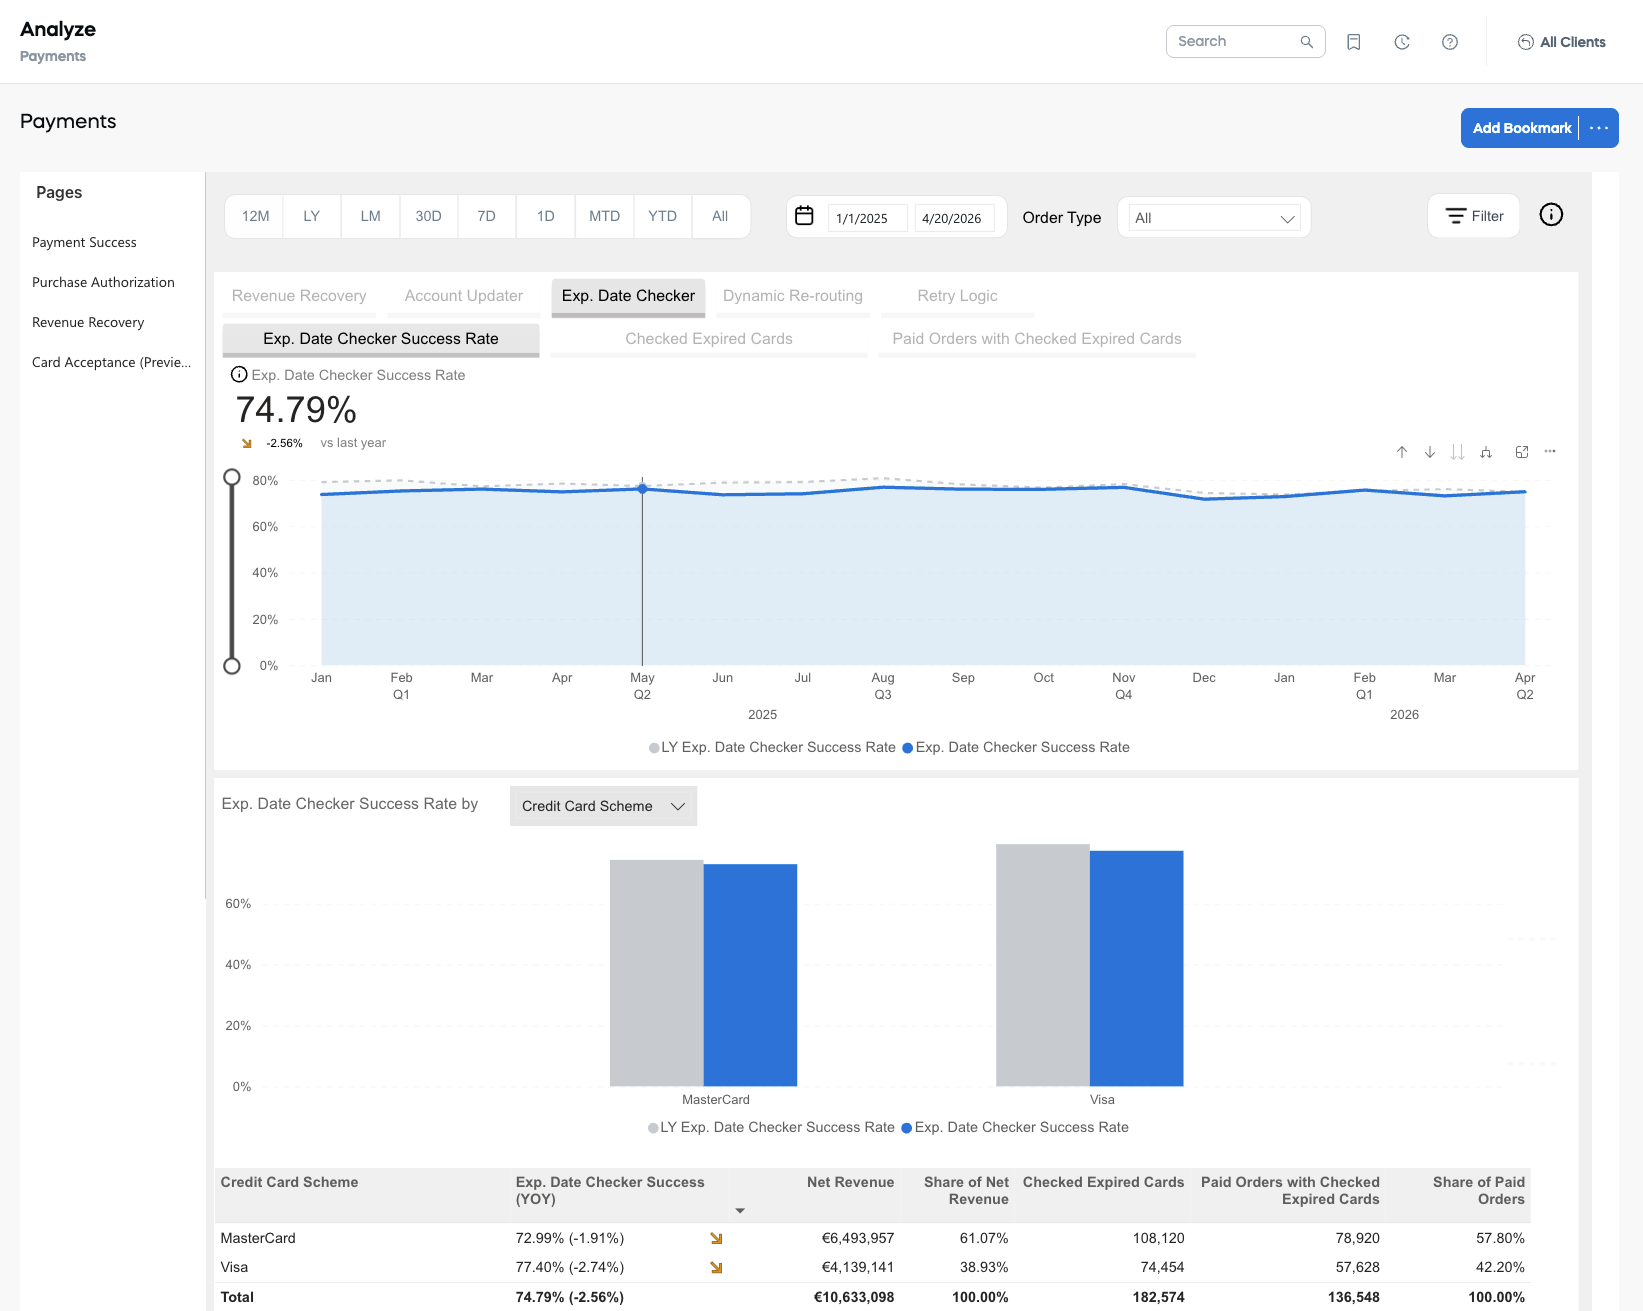
Checked Expired Cards
Number of credit cards, during the selected period and the same period last year, that were checked using the Account Updater and identified as due for renewal. 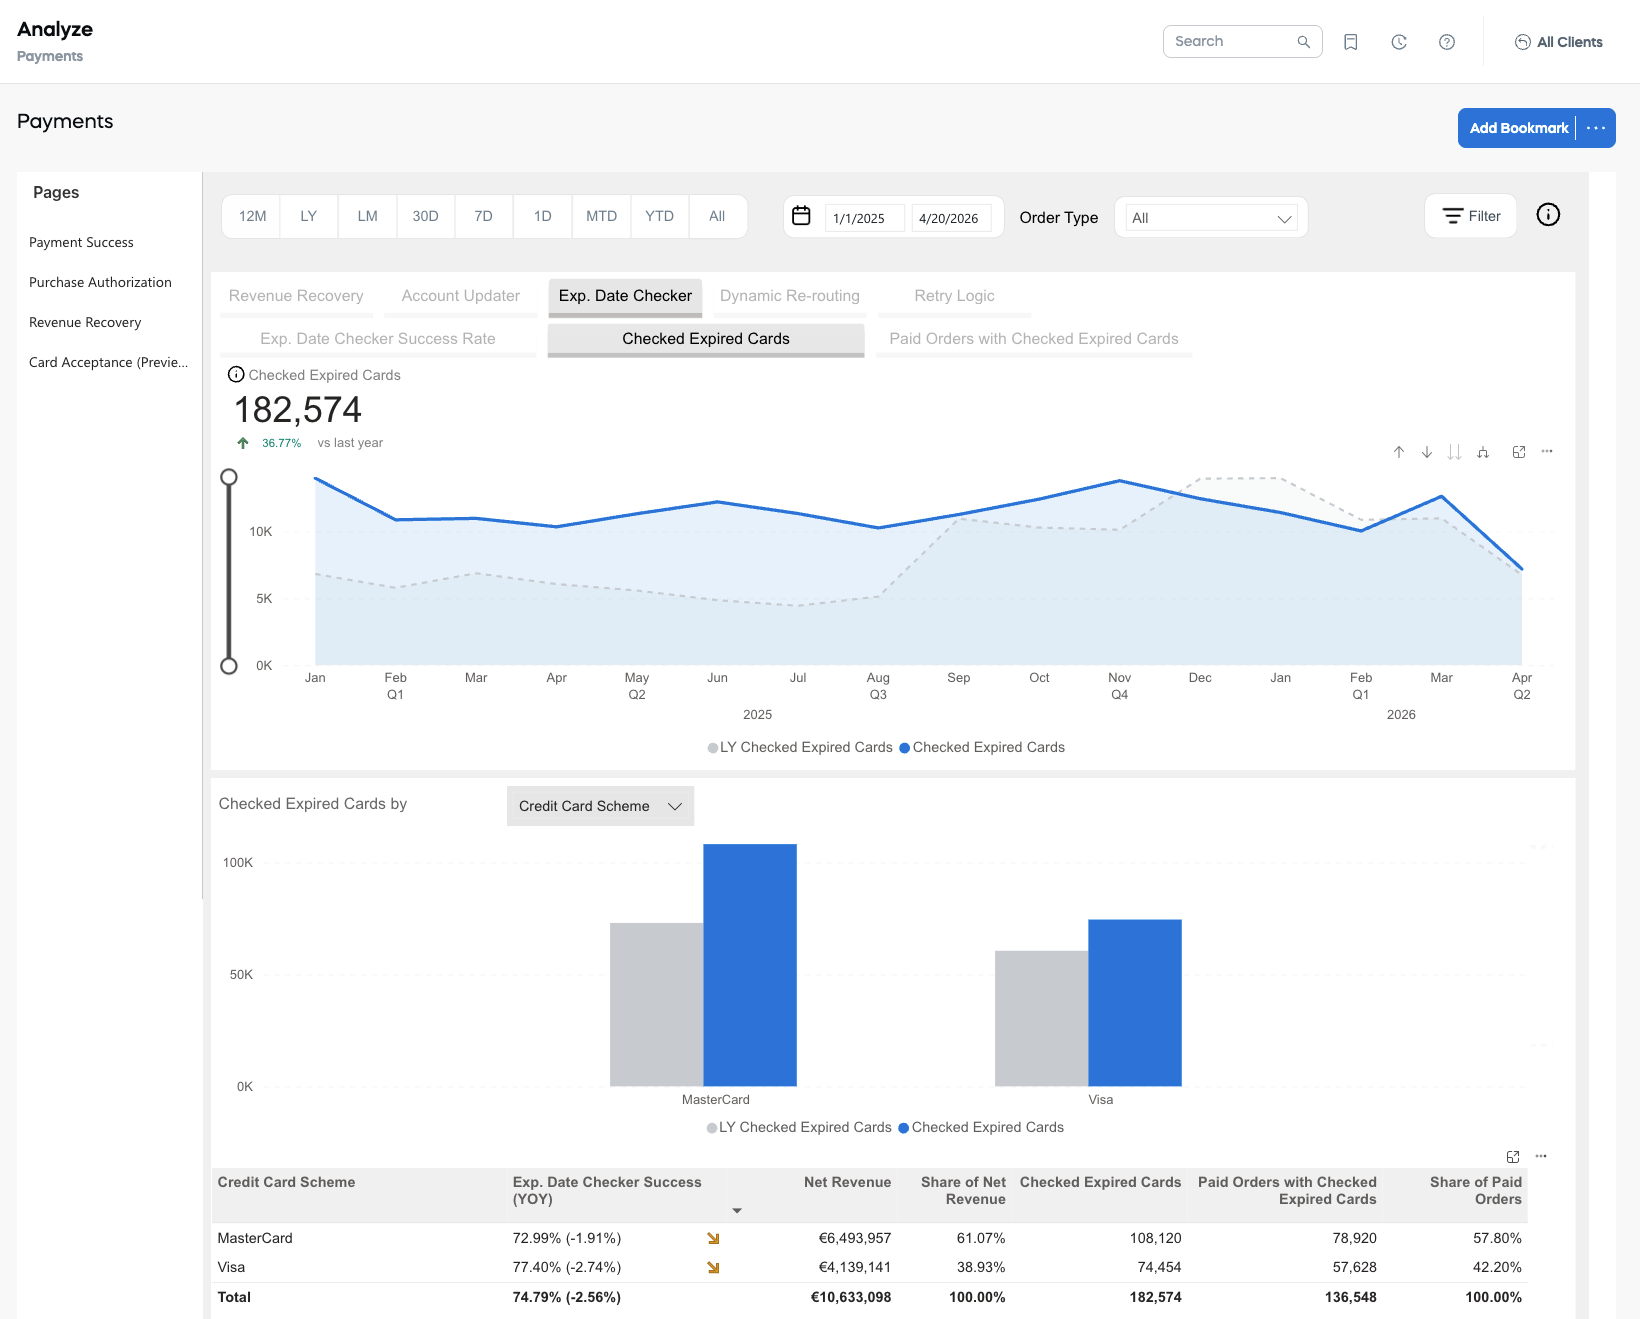
Paid Orders with Checked Expired Cards
Number of orders, during the selected period and the same period last year, with a successfully updated expiration date using the Expiry Date Checker, that were converted into a successful renewal. 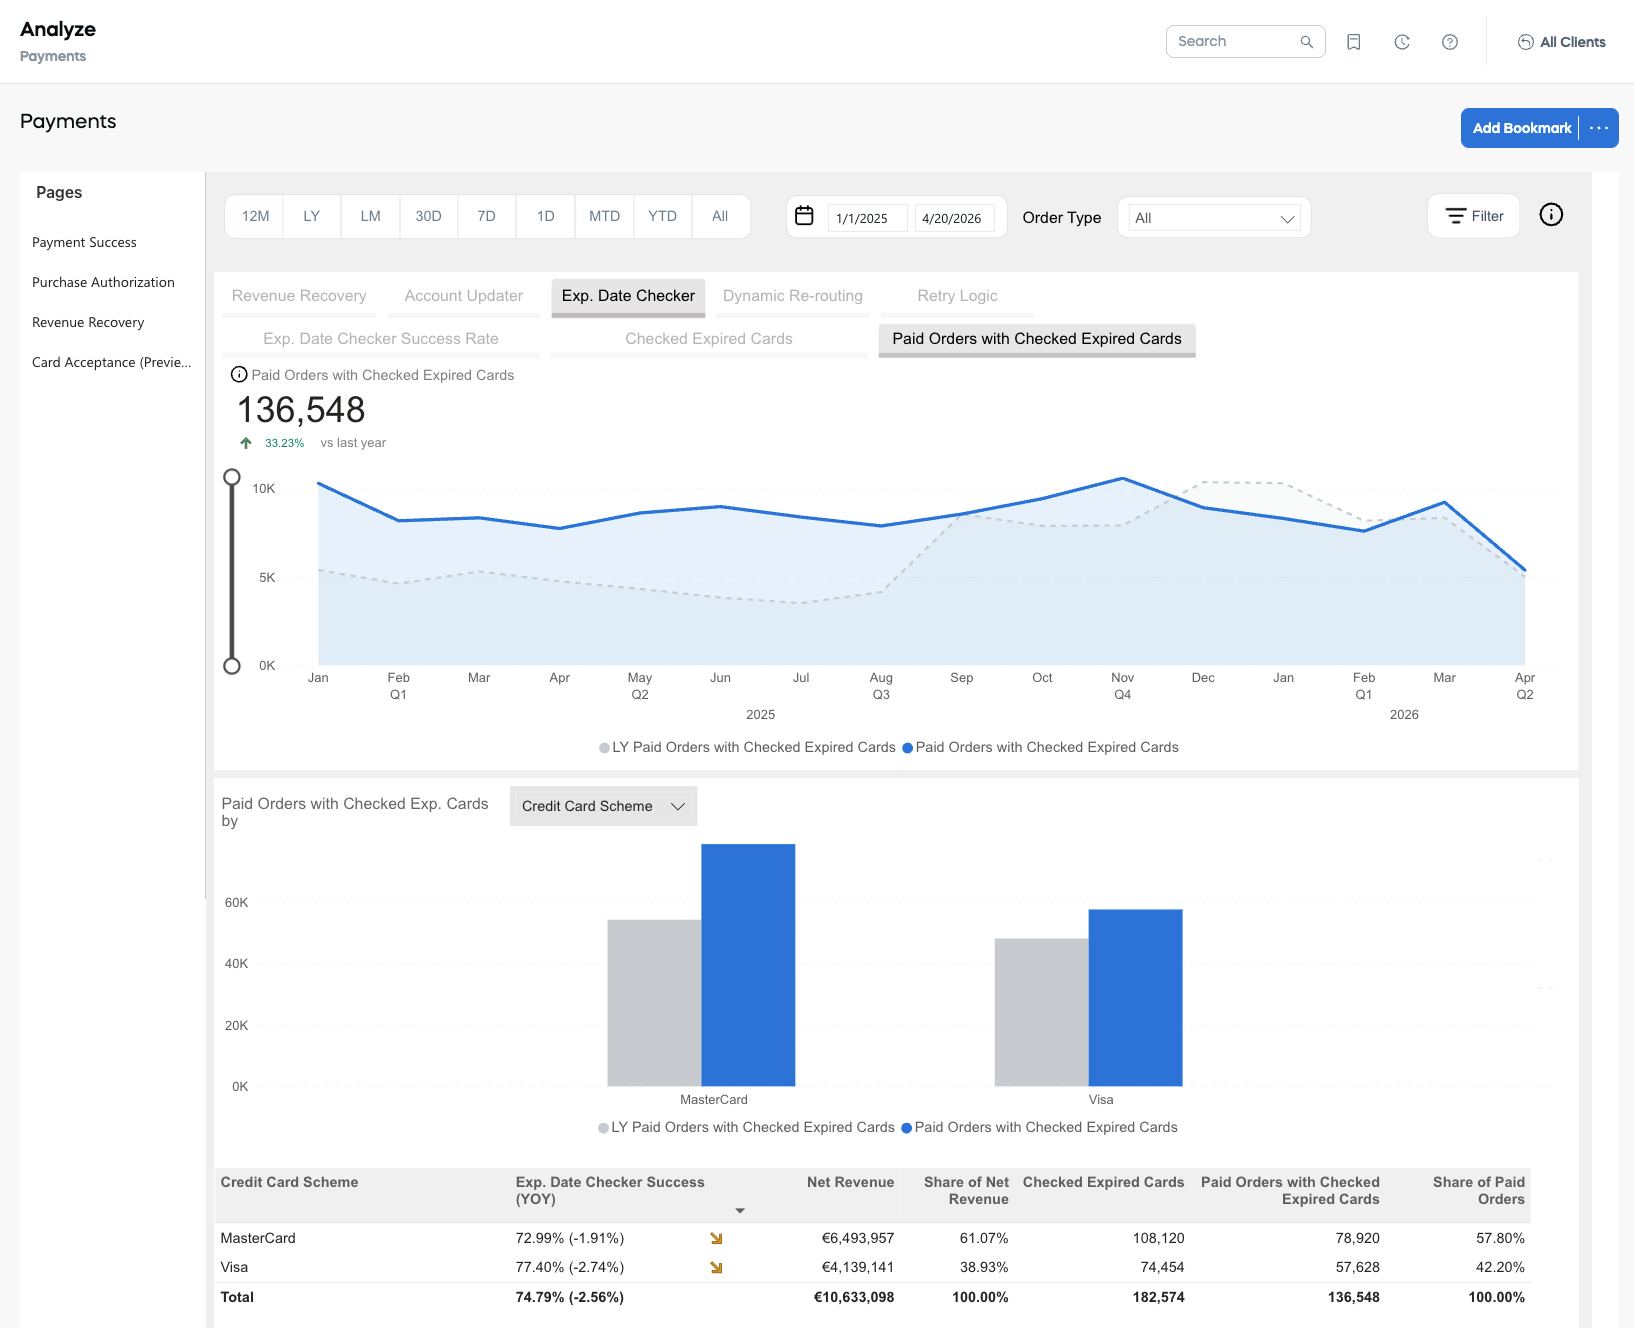
Dynamic Re-routing graphs
The Dynamic Re-routing graphs display the success rate of orders that were rerouted and delivered to secondary acquirers, as well as the number of rerouted orders and the corresponding number of paid orders that were successfully delivered to secondary acquirers, during the selected period and the same period last year.
The Dynamic Re-routing graphs are:
Re-routing Success Rate
Percentage of orders, during the selected period and the same period last year, that were rerouted and delivered to secondary acquirers and were paid for. 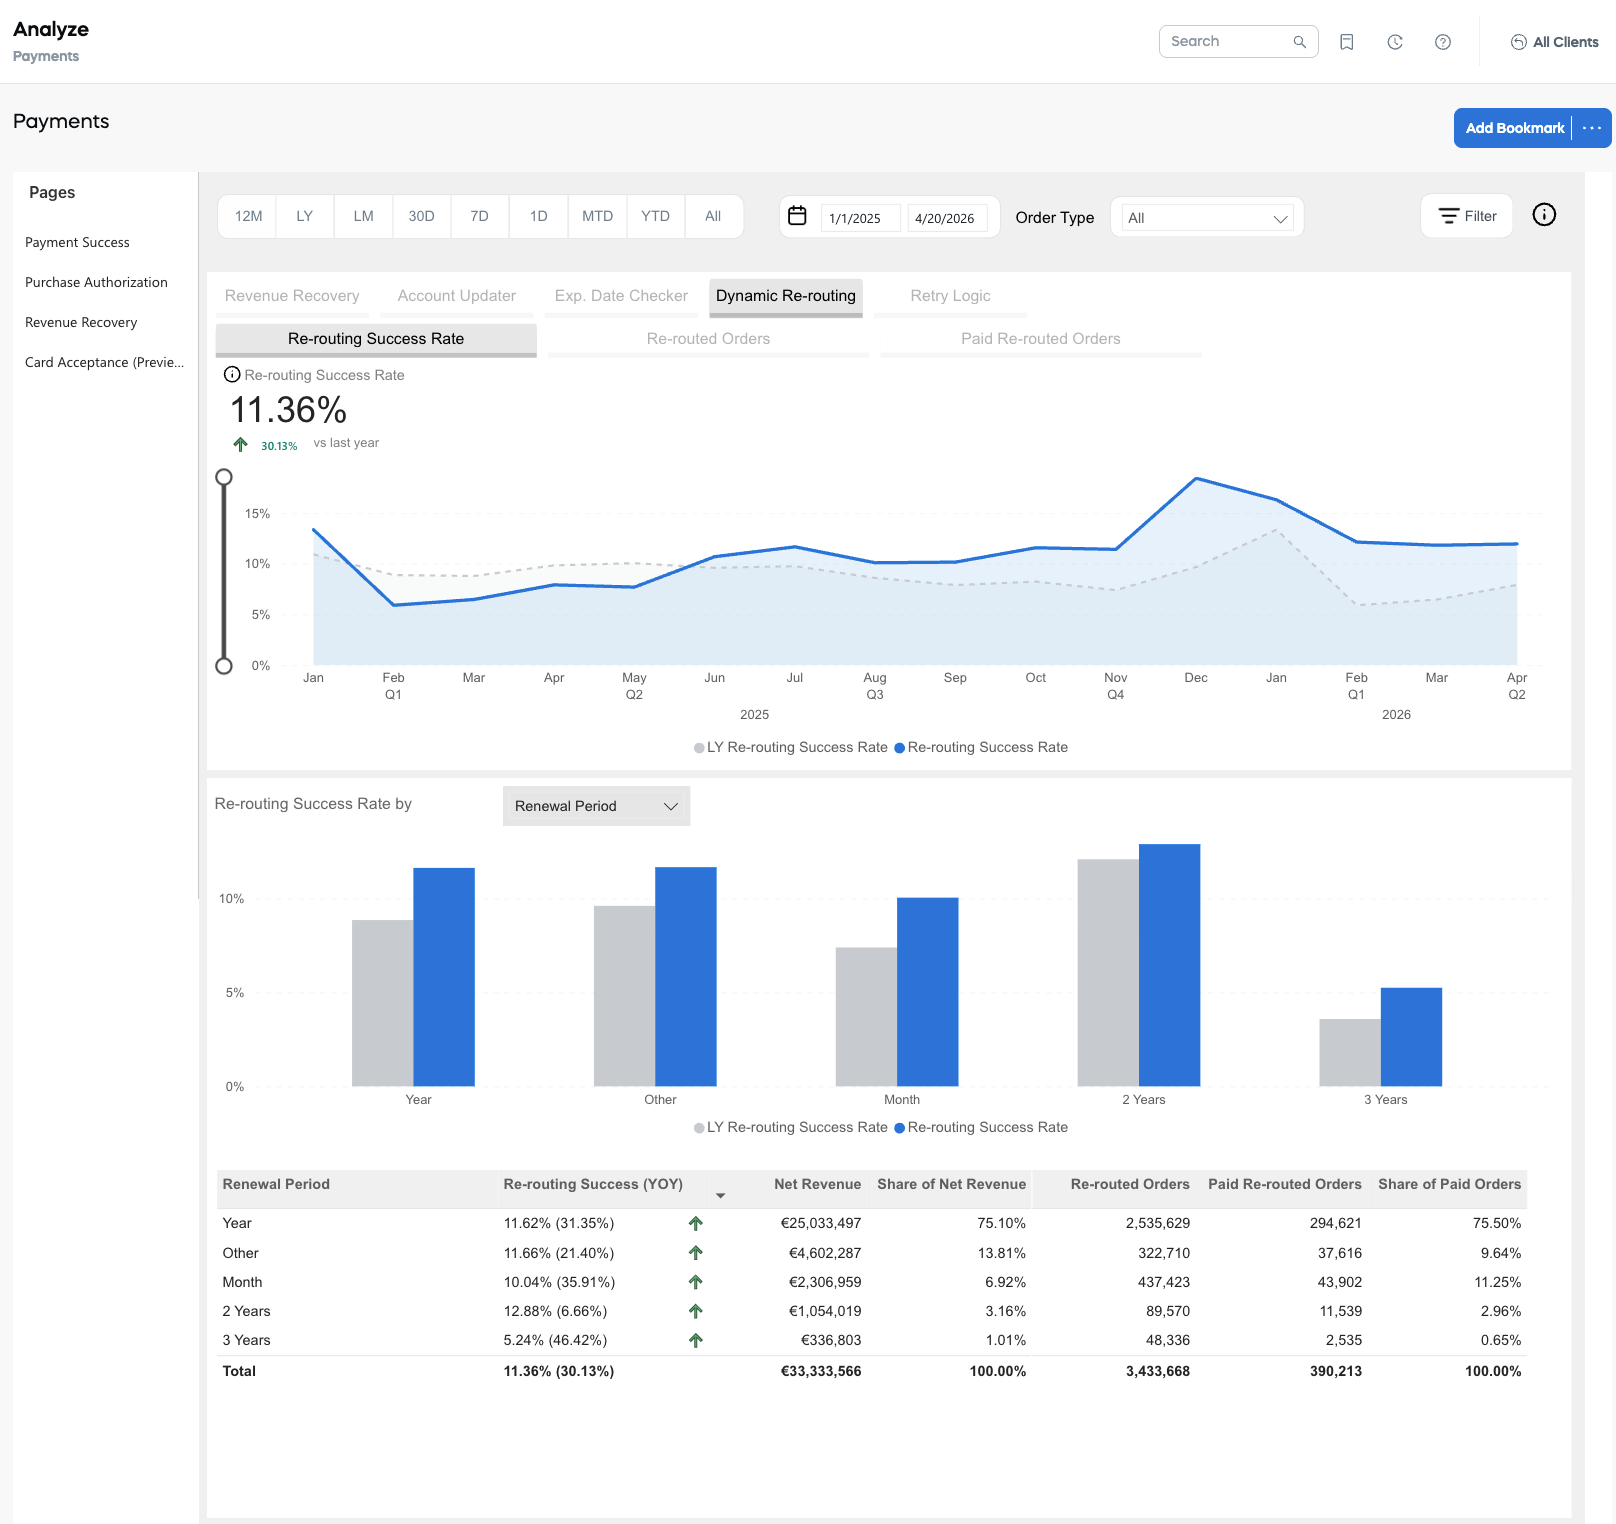
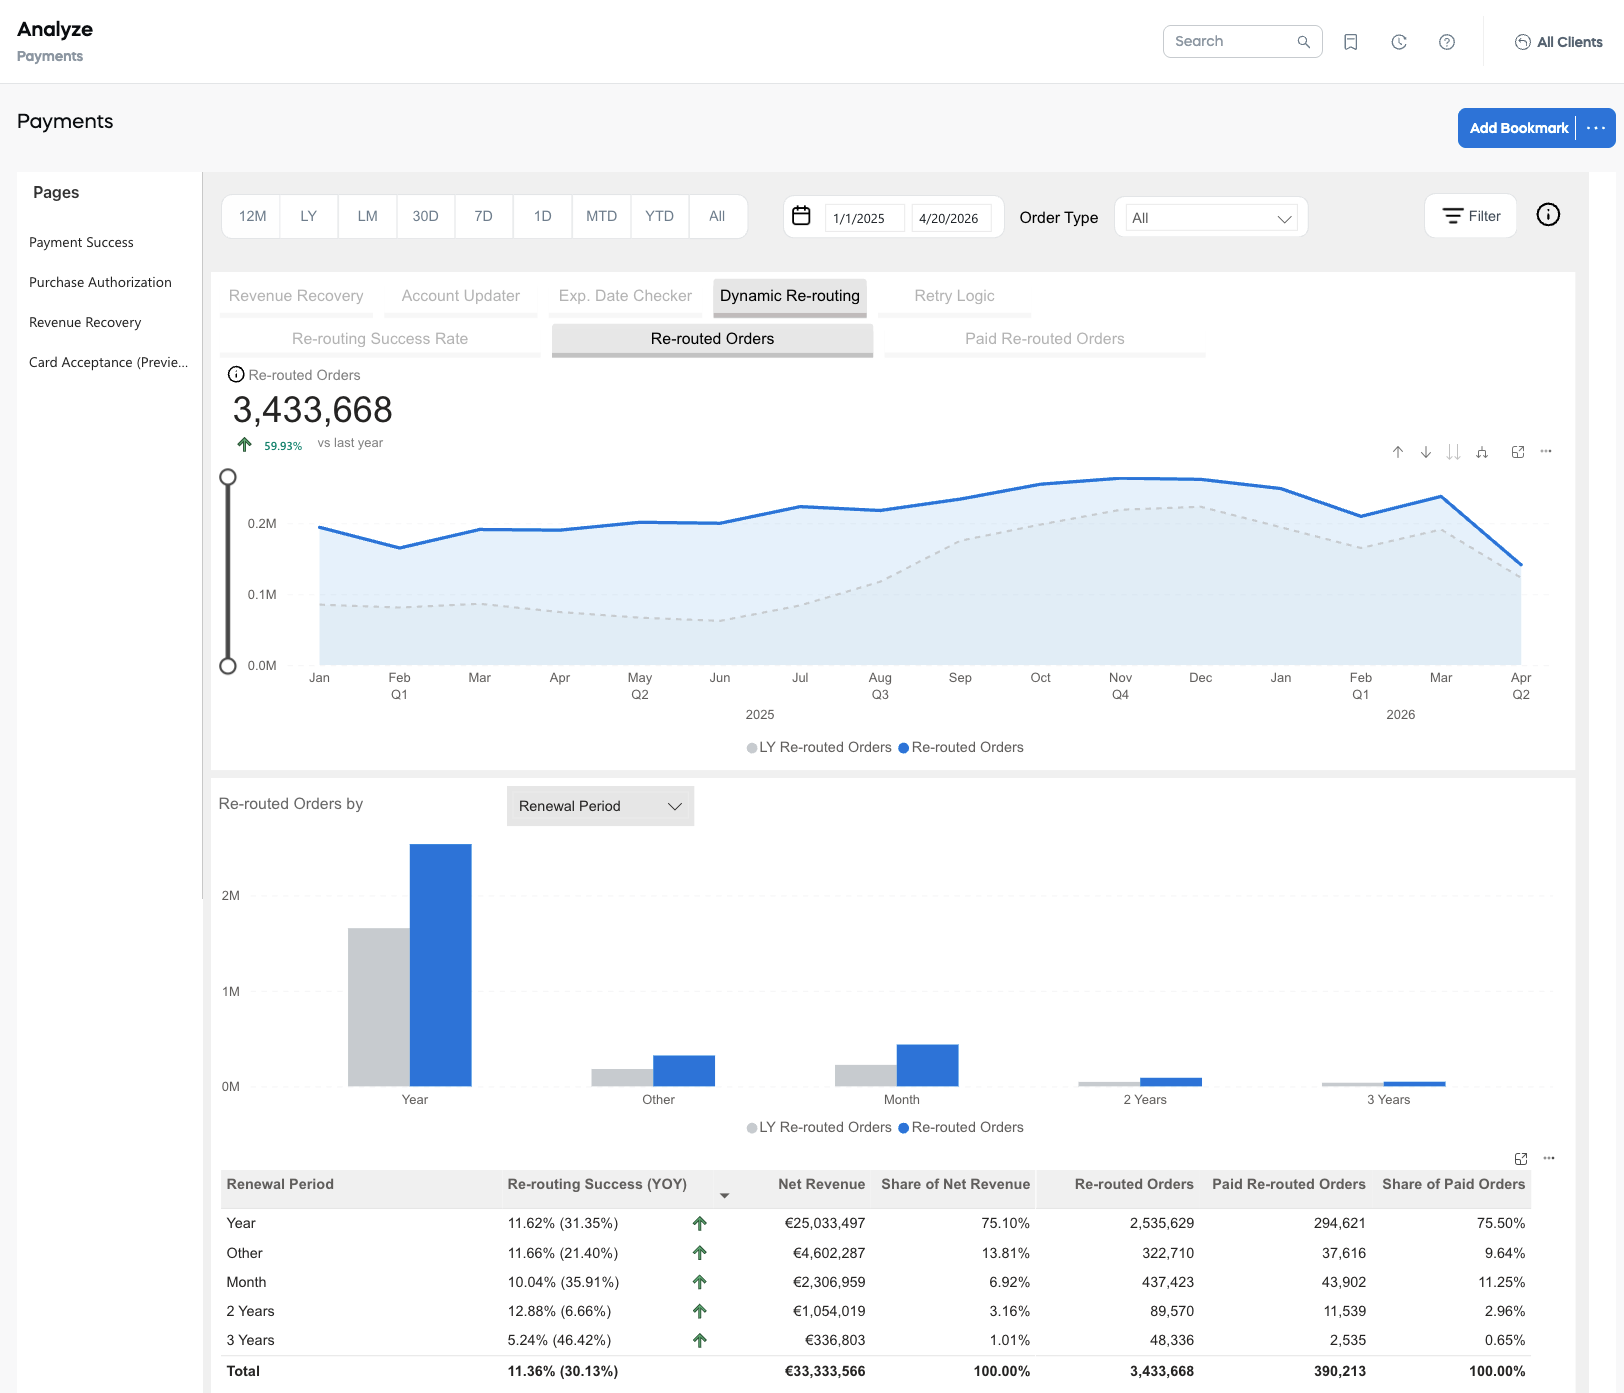
Re-routed Orders
Number of orders, during the selected period and the same period last year, that were rerouted and delivered to secondary acquirers due to the initial unsuccessful attempt to deliver them to primary acquirers.
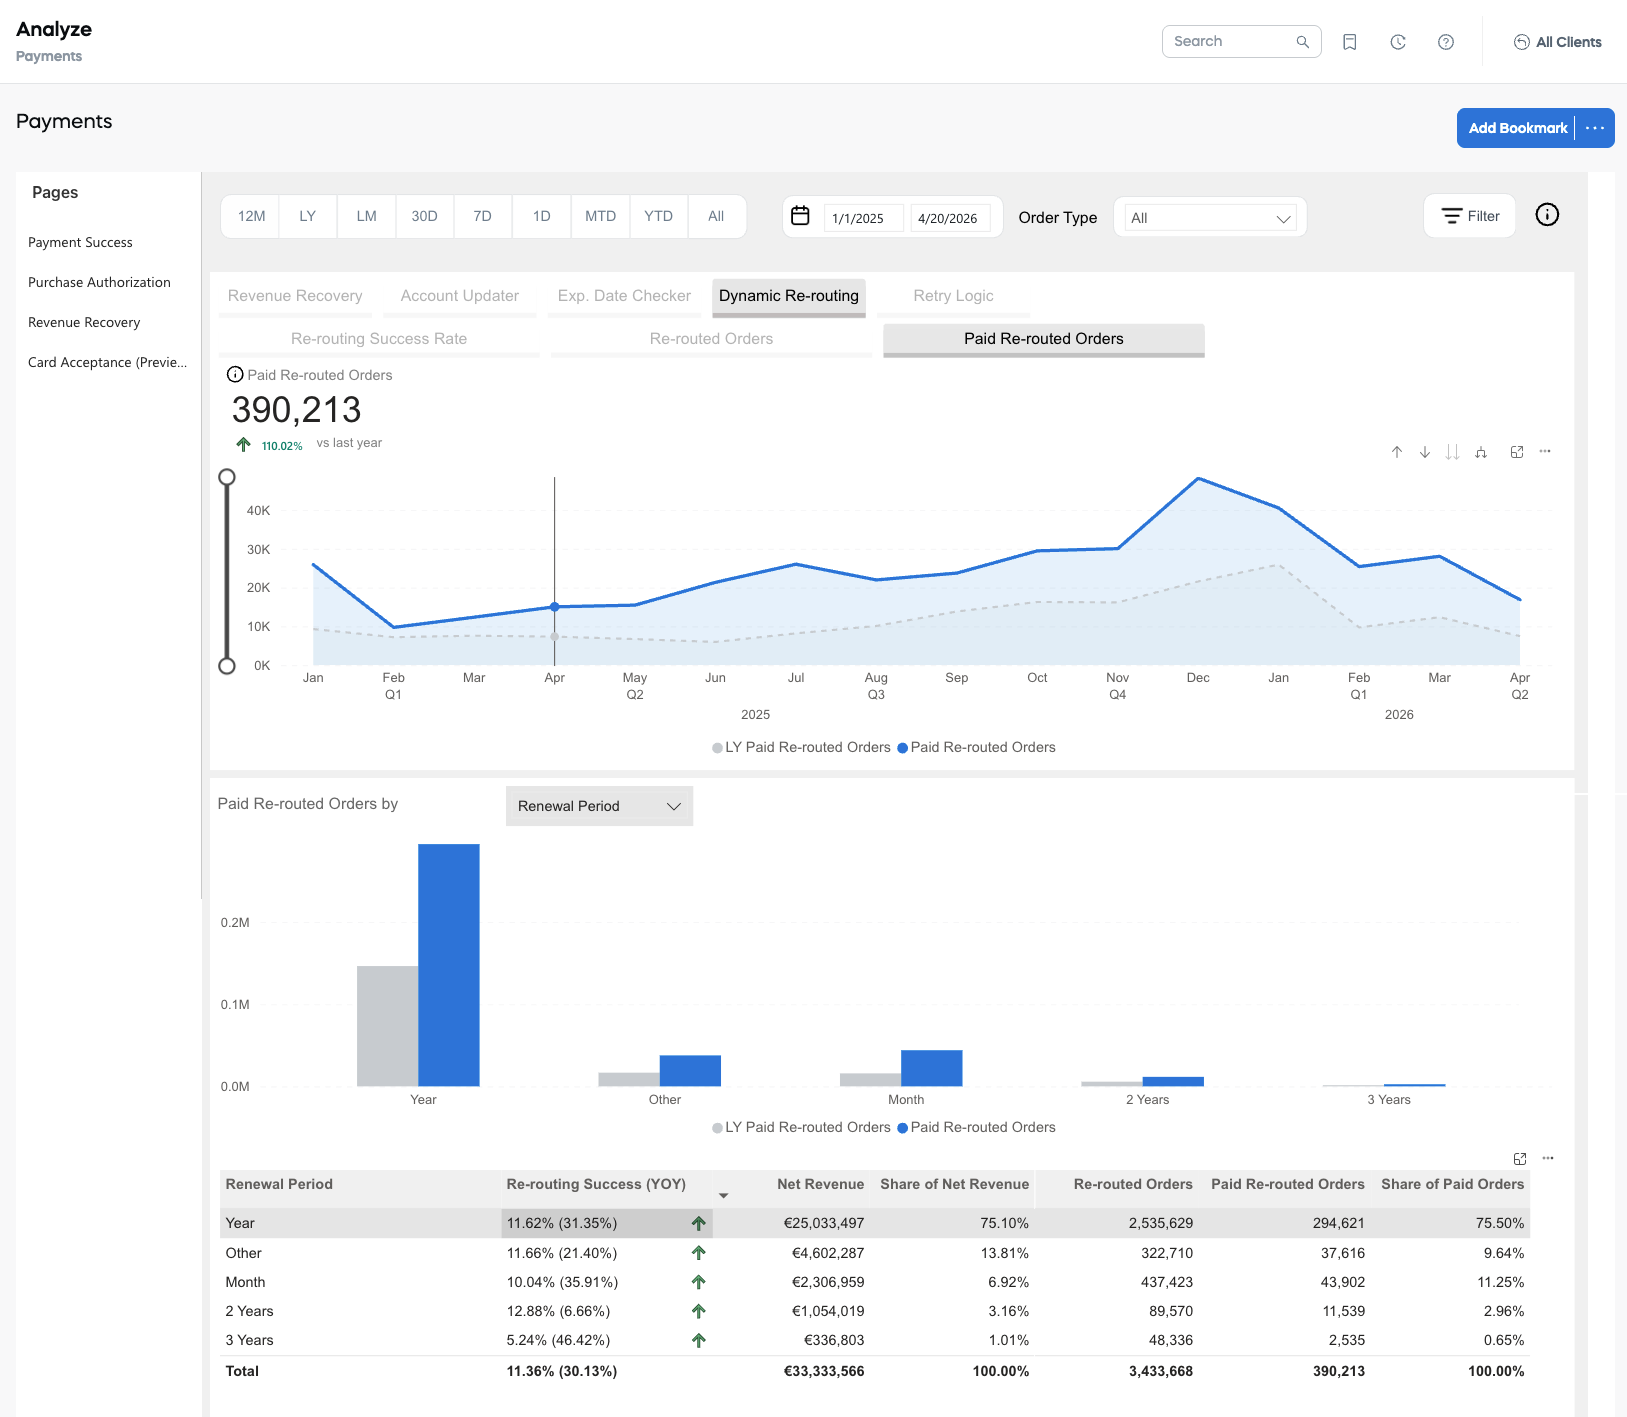
Paid Re-routed Orders
Number of orders, during the selected period and the same period last year, that were rerouted and delivered to secondary acquirers and paid for.
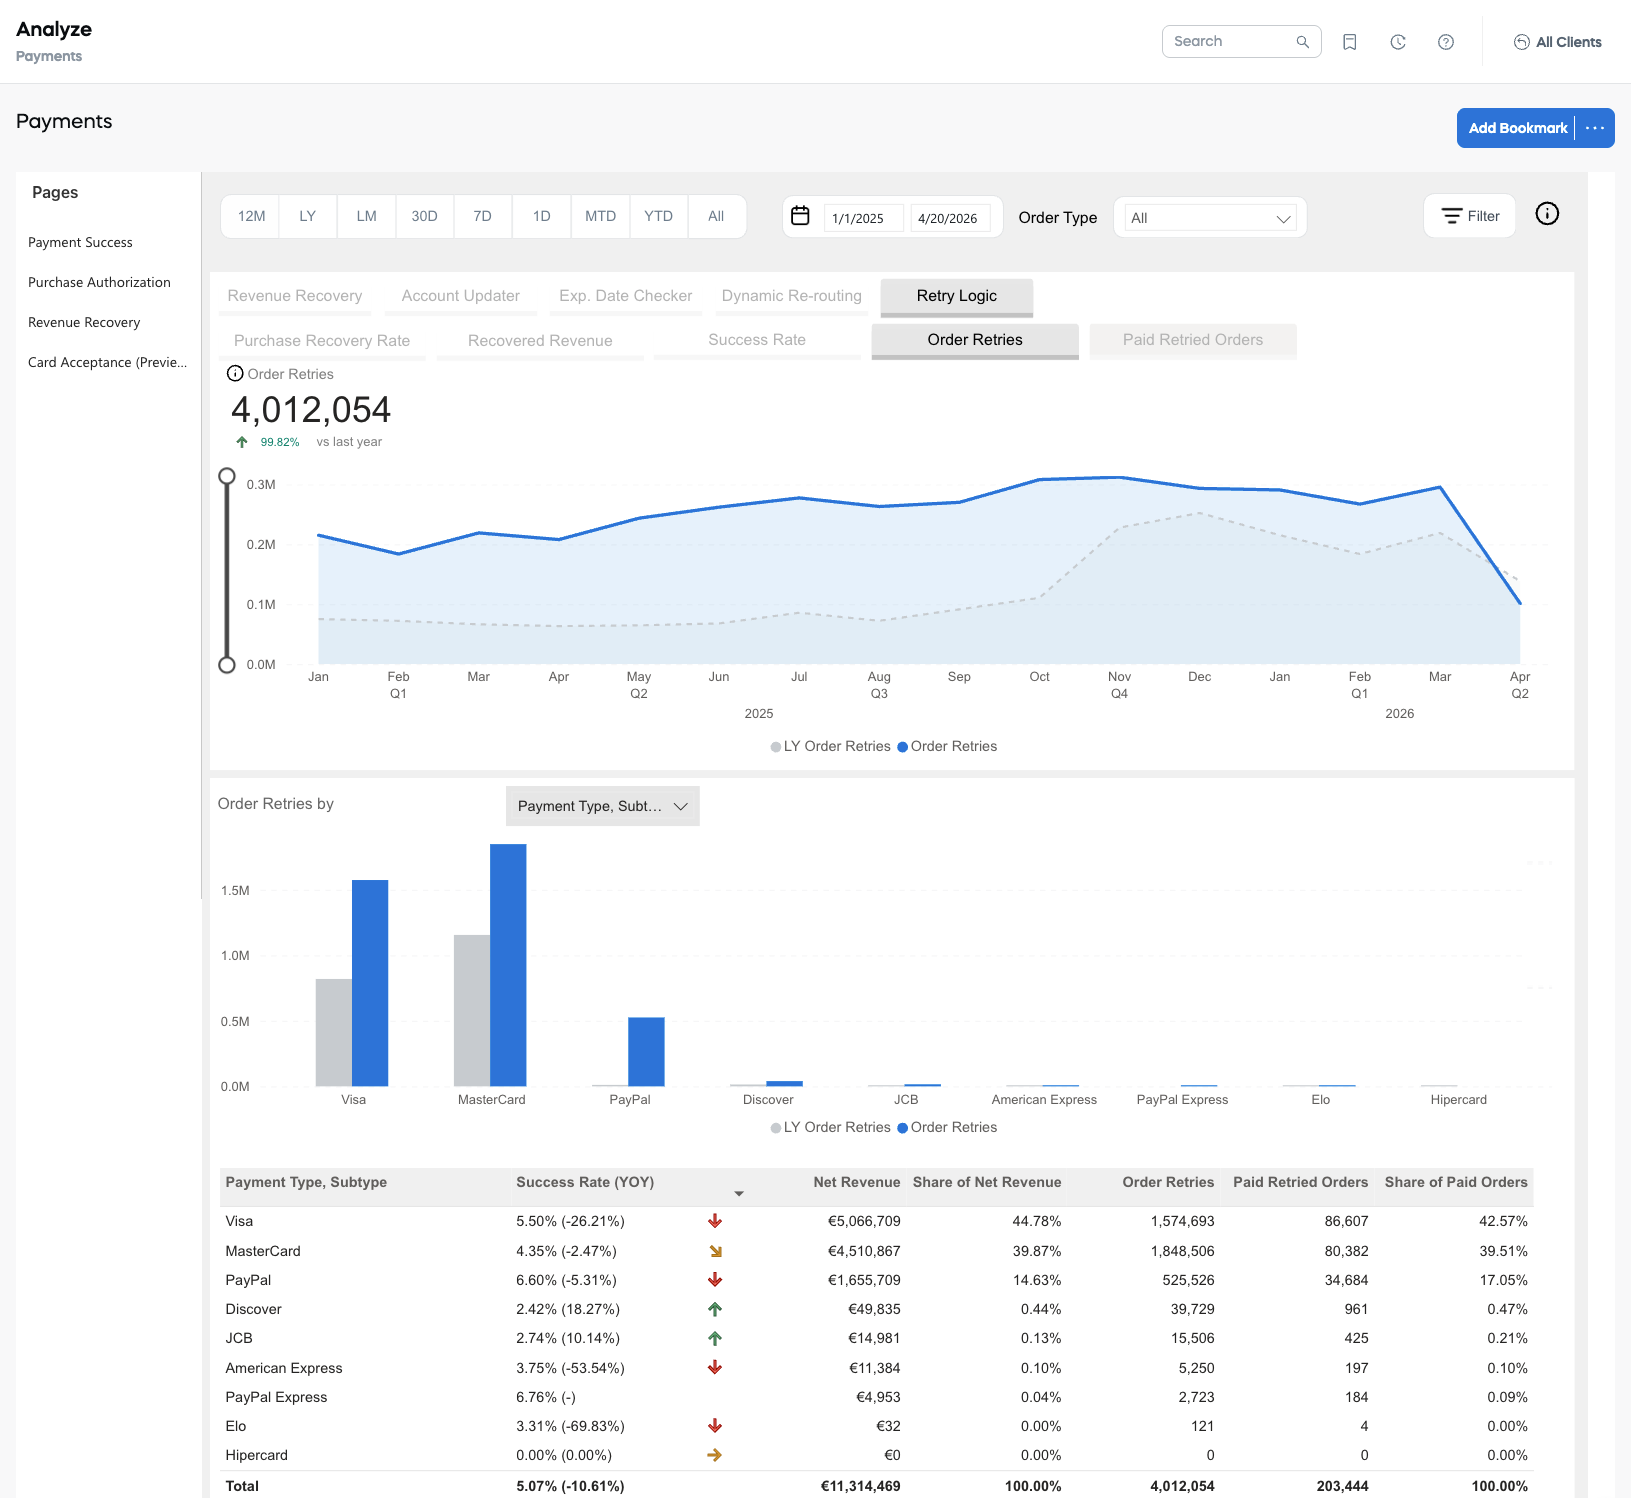
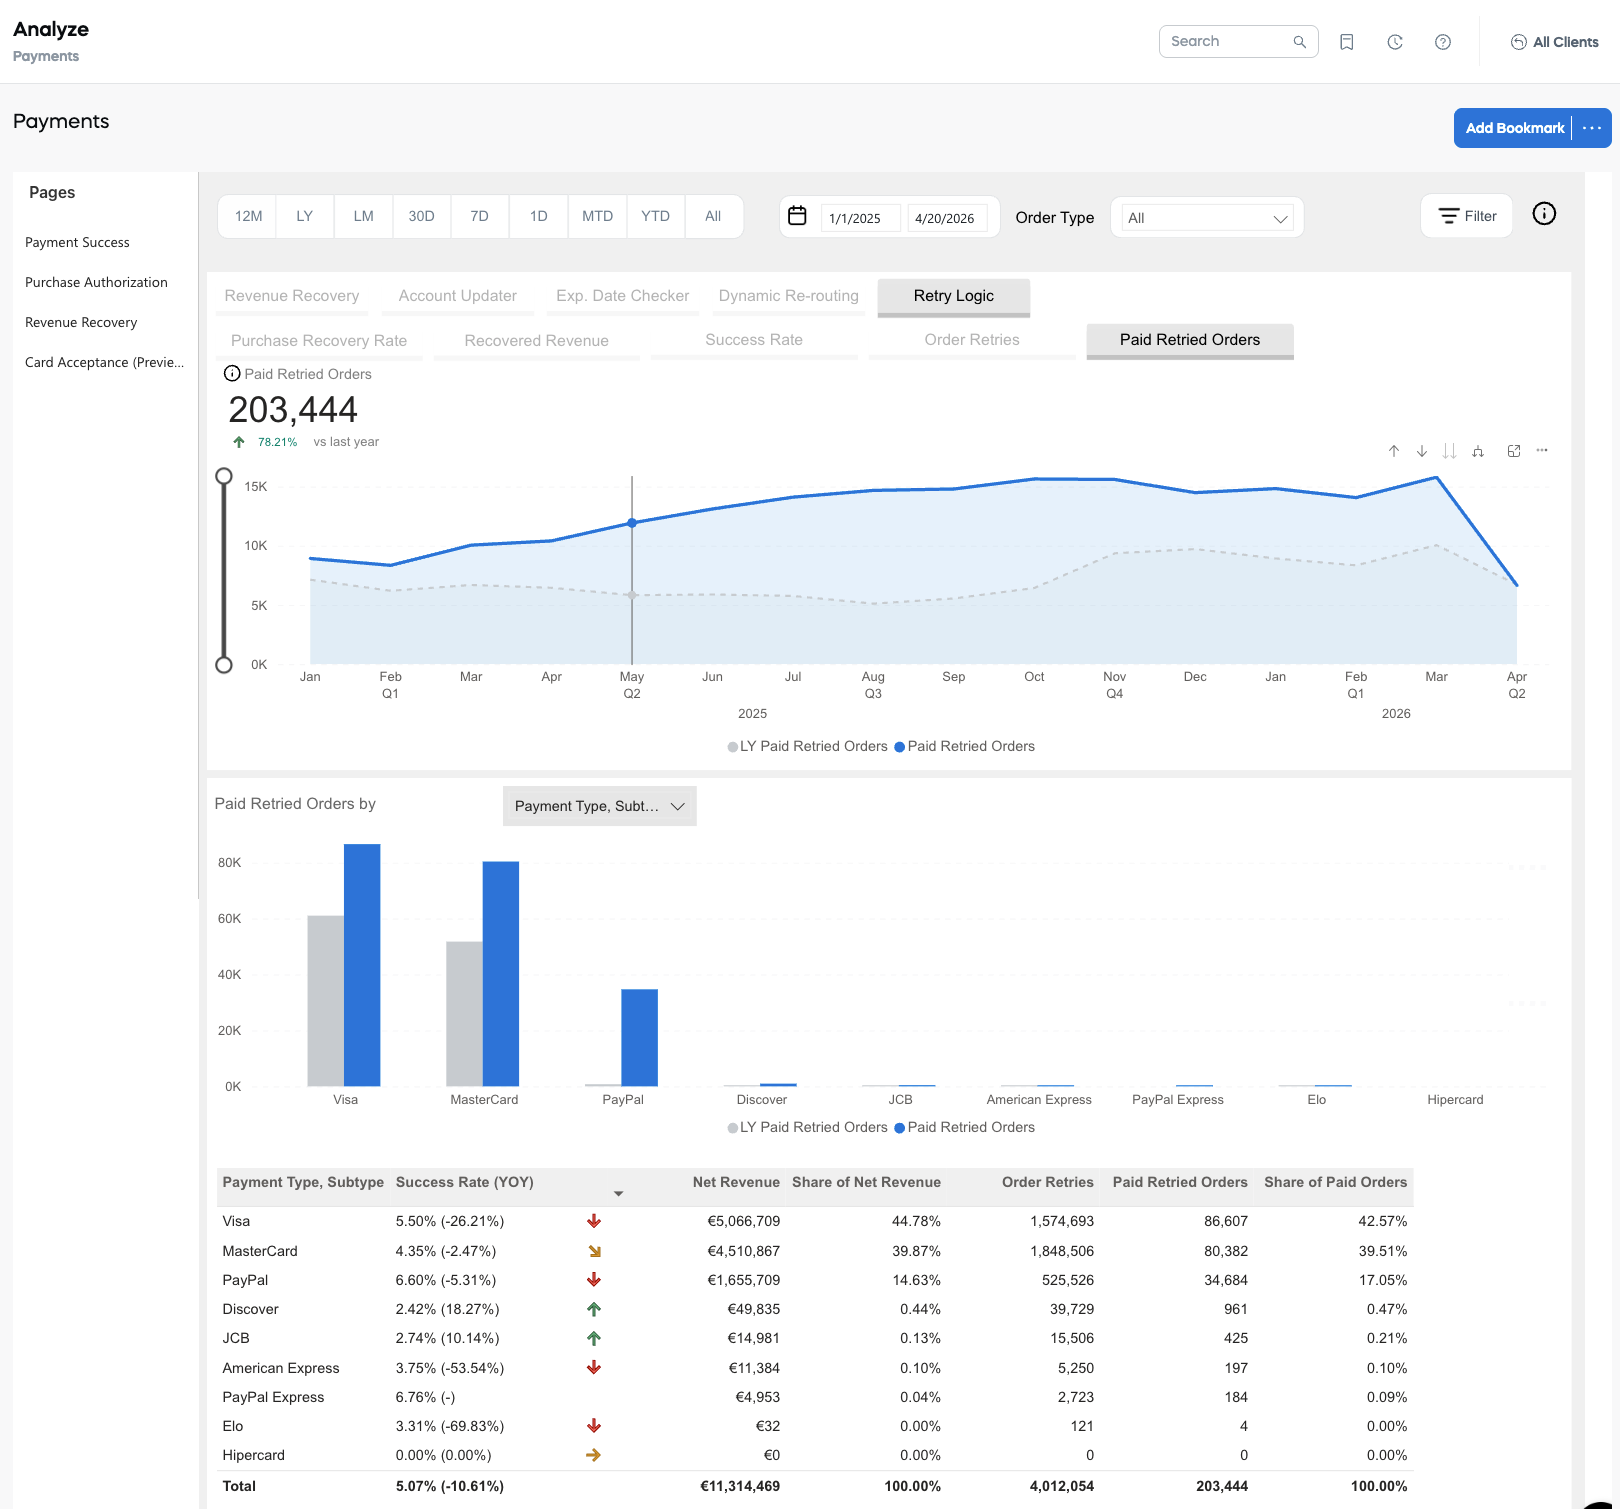
Retry Logic graphs
The Retry Logic graphs show key metrics related to order retries, such as the purchase recovery rate, revenue recovered from dynamic and static retries, the number of order retries and paid retried orders, and their ratio for both the selected period and the same period last year.
The Retry Logic graphs are:
Purchase Recovery Rate
The ratio of all paid retried orders to all retried orders. With this report, you can see how well the specific retry mechanism works from the perspective of specific purchases.
Even if several order retries have been performed for one order, it is still treated as one retried order. The report can be generated for all retries, as well as dynamic retries, or static retries only (the Retry Type filter).
-344cd31344b6a133321aa10b62881f7f.png)
Recovered Revenue
The total amount of recovered renewal revenue that was recovered as a result of order retries. The report can be generated for all retries, as well as dynamic retries, or static retries only (the Retry Type filter). It provides insights into the effectiveness of different retry strategies and the financial impact they have on overall revenue recovery.
-8ebd4ab87000e07f399e8ea70e58c29c.png)
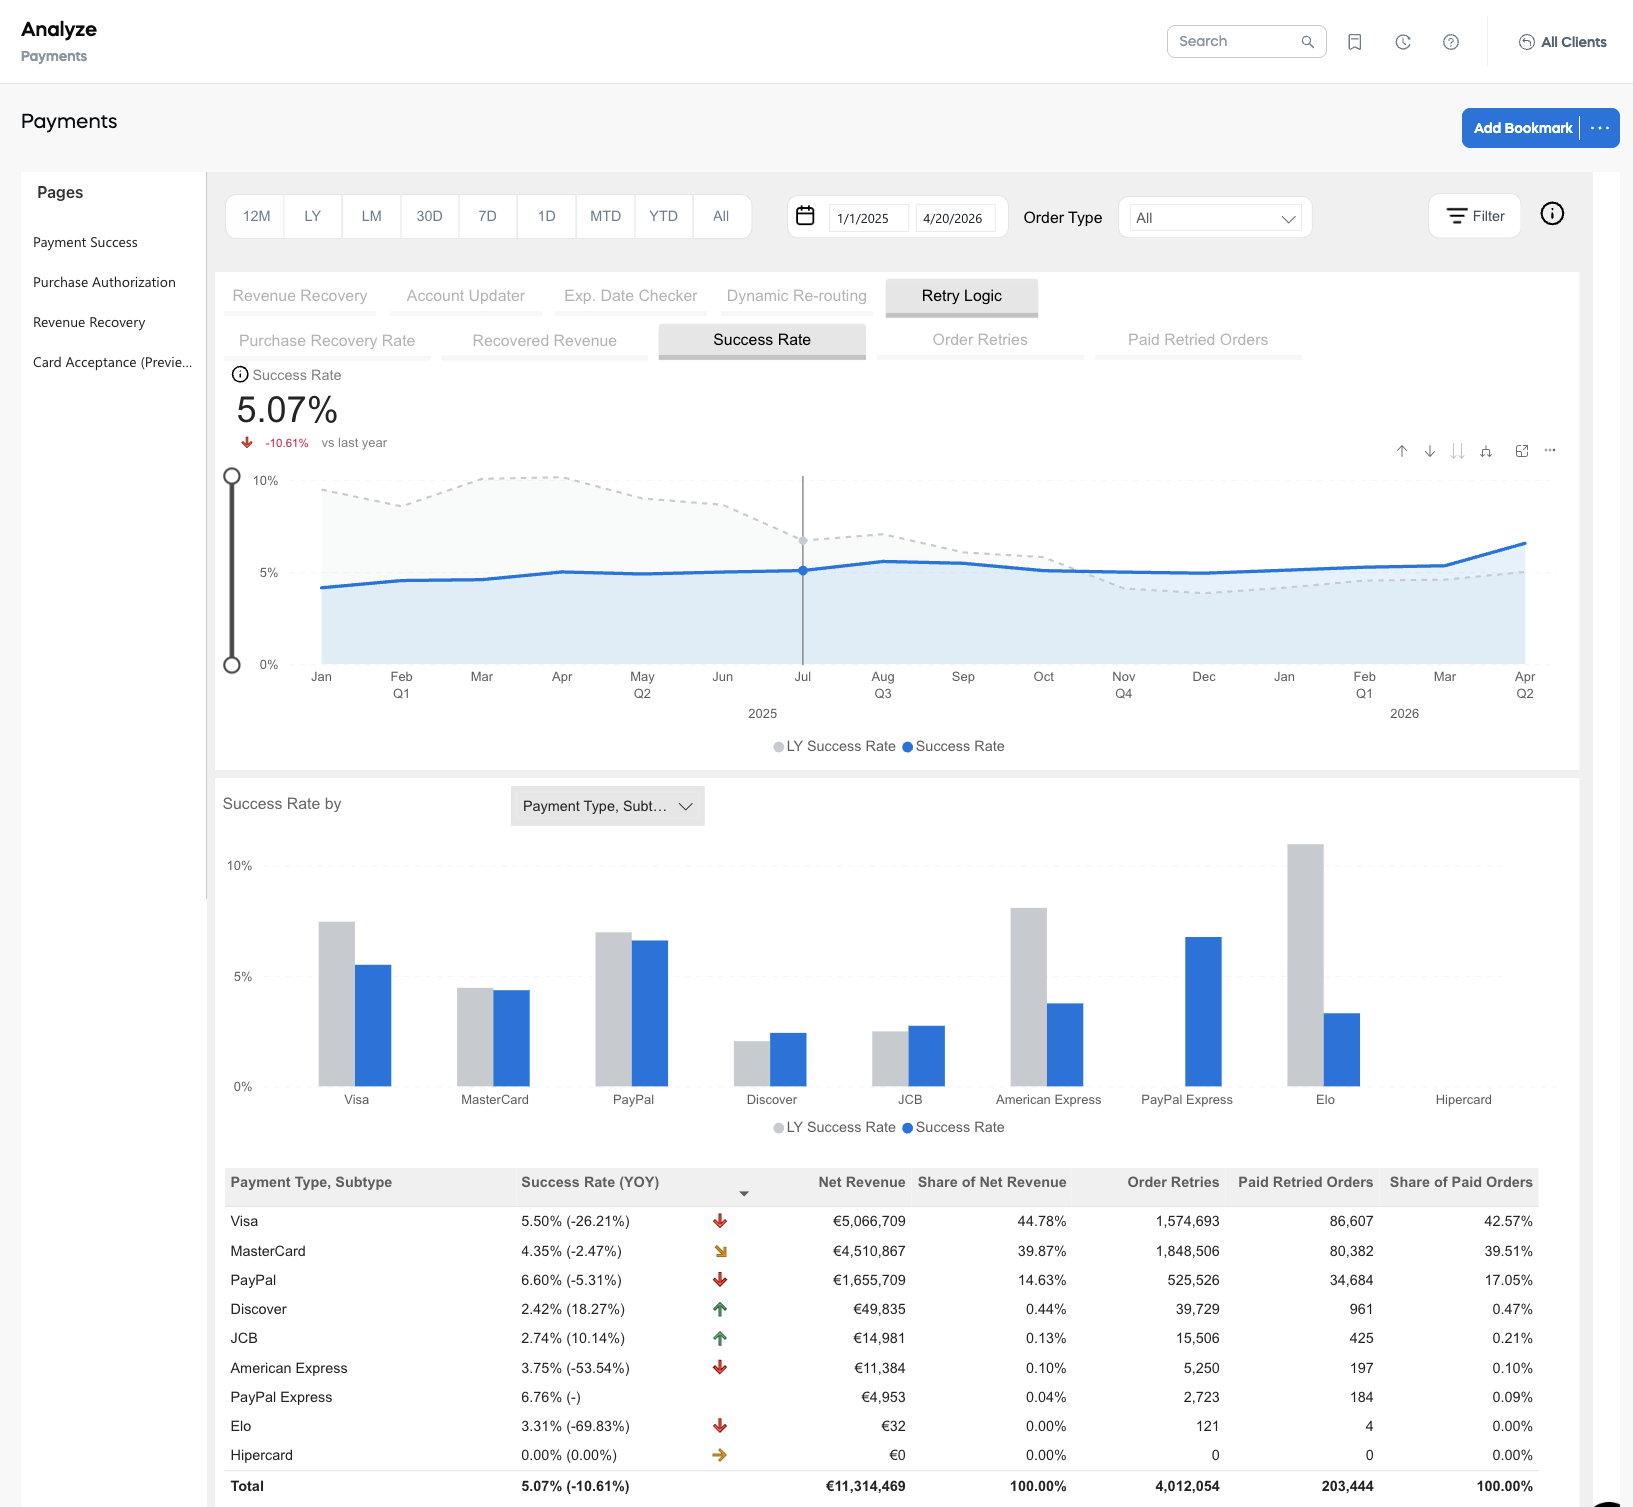
Retry Success Rate
The share of paid retried orders (order retries that resulted in renewals/paid orders) in the total number of order retries.
Even one retried order can have several order retries, and all of them will be considered in the report.
This rate is calculated as follows: (paid order retries / order retries) * 100.
Order Retries
The number of order retries for the selected period and the same period last year. Please note that even one Retried Order can have several Order Retries and all of them will be considered in the report.
Paid Retried Orders
The number of retried orders for the selected period and the same period last year which resulted in successful payments.
Card Acceptance page
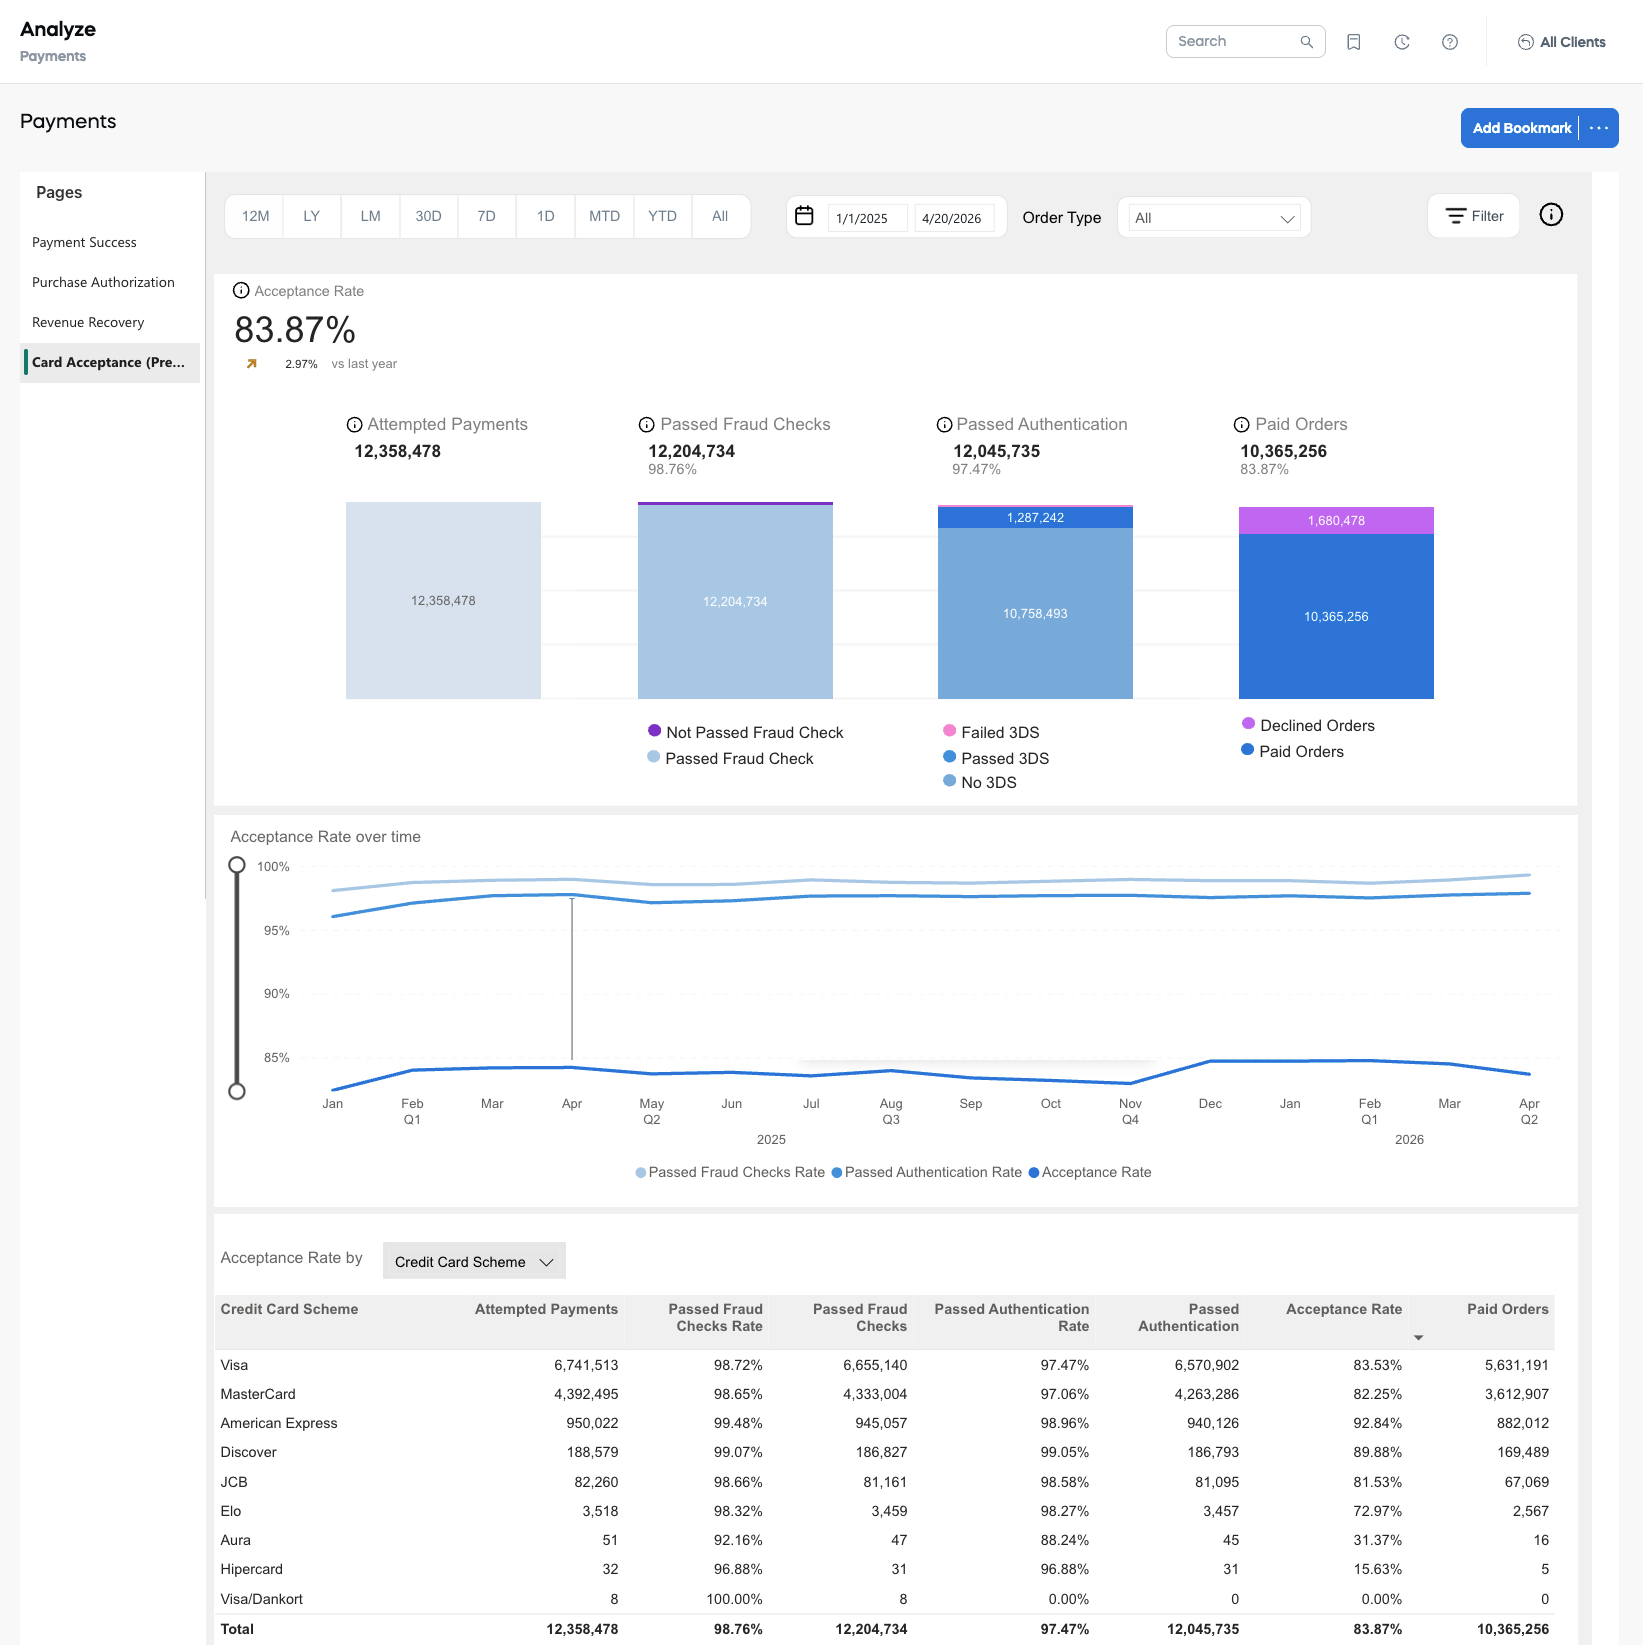
The Card Acceptance page displays charts with information on Card Acceptance Rates over a period of time, providing detailed breakdowns of different payment stages, such as fraud checks and 3D Secure (3DS) authentication. The acceptance rate is a crucial metric for optimizing authorization strategies. A high acceptance rate indicates a smooth and efficient payment process, while a lower rate may highlight issues such as declined transactions, potential fraud concerns, or performance issues with payment providers. The Card Acceptance report is designed to provide clients, SCM, and payment support teams with comprehensive insights into card payment processing effectiveness.
The report contains bar charts presenting the total amount and percentage of attempted card payments, passed fraud checks, passed authentication, and accepted payments. The following charts are included:
- Attempted Payments: The chart displays the total count of card payment attempts recorded during a purchase process. The value includes purchase records with the statuses "New", "Authorized", "Paid", "Payment Declined", and "Cancelled".
- Passed Fraud Checks: The breakdown of allowed card payment transactions—that is, payment transactions that have successfully cleared fraud detection mechanisms and have been permitted to proceed—against the attempted transactions. Not Passed Fraud Checks are those assigned any of the fraud-related payment statuses: "Order Declined in Manual Review", "Order Auto-Declined by System", "Order Blocked for Export Compliance", or "Declined in Manual Export Compliance Review".
- Passed Authentication: The breakdown of card payment transactions that have successfully completed the required 3D Secure authentication (Passed 3DS), the card payment transactions that bypassed or do not require authentication (No 3DS), and those for which the authentication attempt failed (Failed 3DS)
- Paid Orders: The breakdown of successfully processed orders (Paid Orders) compared to the count of orders assigned the "Declined" or "Cancelled" statuses (Declined Orders). The order is "Paid" when the payment has been received and information about product delivery has been dispatched. The Paid Orders metric includes one-time purchases, initial subscription payments, and recurring subscription payments. Successfully paid orders also account for those where a refund or chargeback was processed after the payment.
Below the charts, you can see a graph showcasing the Acceptance Rate metrics over time.