MVT Campaigns analytics
MVT Campaigns analytics provides actionable insights to help you understand and optimize the performance of your multivariate testing (MVT) campaigns.
This analytics tool enables you to filter and explore campaign data across multiple dimensions. You can easily identify which factors drive success or contribute to underperformance, helping you make informed decisions and refine your strategies.
Use MVT Campaigns Analytics to:
- Gain a clear view of campaign performance across variations and dimensions.
- Pinpoint the key drivers of positive results.
- Diagnose underperforming elements to improve future outcomes.
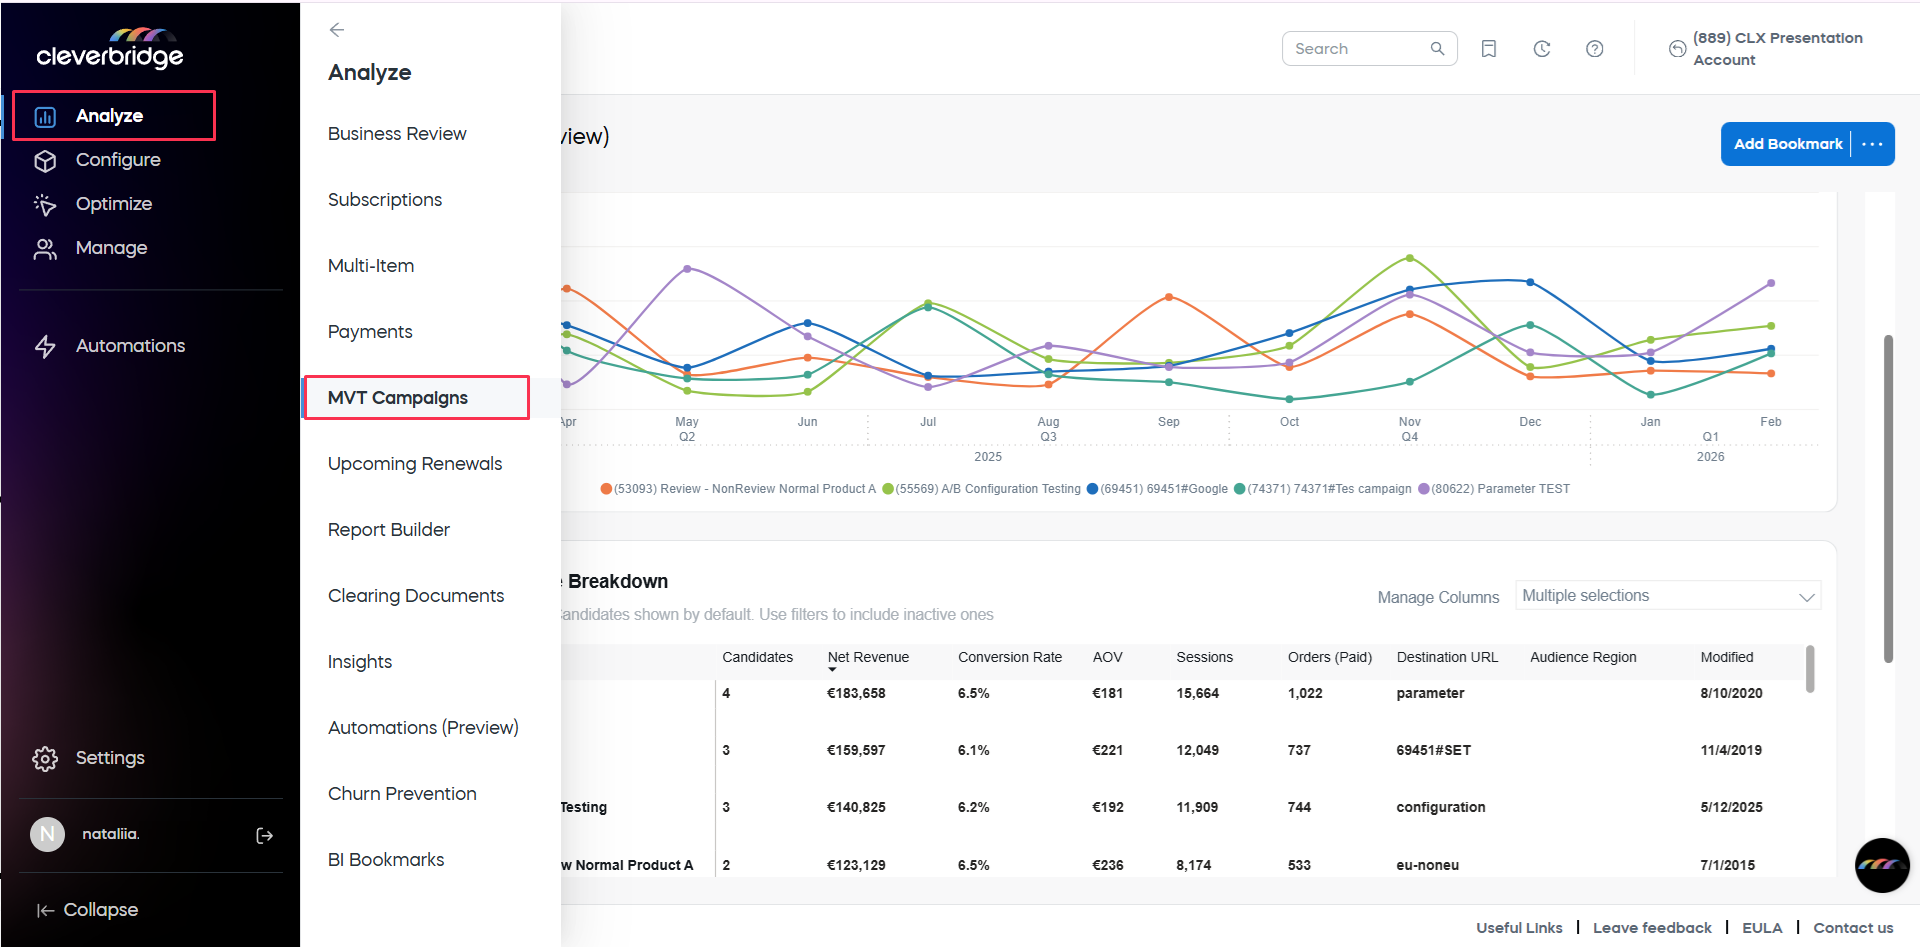
To access the analytics, navigate to Analyze > MVT Campaigns.
Available modes
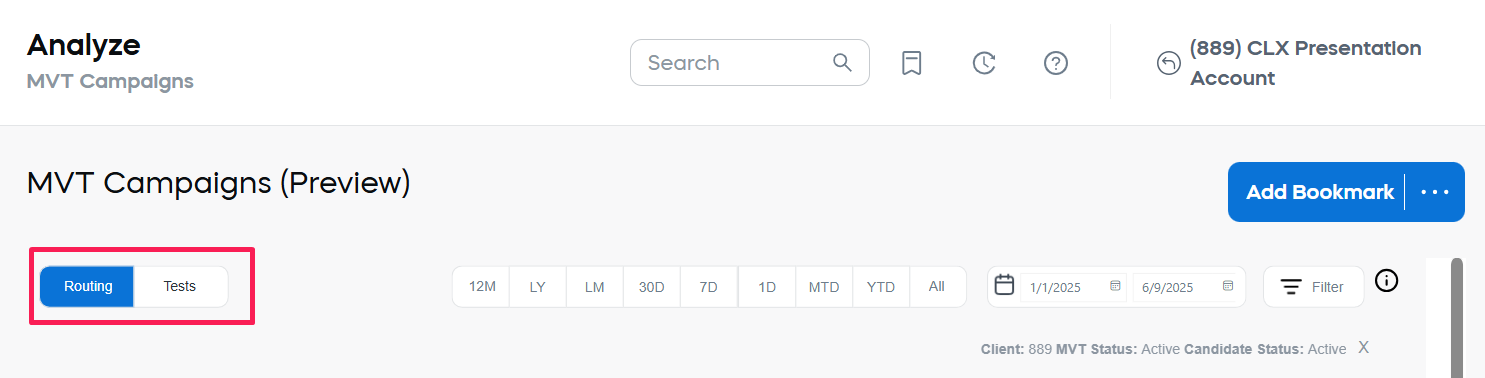
A Mode Selector, located at the top left above the chart area, allows you to switch seamlessly between two analysis modes:
-
Routing: View the performance of all MVT Campaign routings—whether or not a test is actively running. This mode enables you to analyze how different routing strategies are impacting key performance metrics such as revenue, conversion rate, and average order value across customer segments and dimensions.
-
Tests: Focus specifically on the results of MVT tests by comparing test candidates (variants) against a control candidate within a selected test audience. If a control was removed, changed, or the routing was edited after the test ran, switch from Running to Historical and manually select the candidates to compare.
Routing mode
When the Routing mode is selected, the MVT Campaign Analytics report provides a comprehensive view of how your MVT Campaigns perform under your configured routing rules.
The Routing view consists of two main components:
- An interactive Performance Chart, which can be configured to display either:
- Top Performing Campaigns over time, based on key performance metrics, or
- Top Performing Audience Regions over time, enabling geographic trend analysis.
- A detailed Candidate Performance Breakdown Table, which provides granular performance data for each candidate across your MVT Campaigns. This table supports advanced filtering, column customization, and export to Excel for further analysis.
Together, these components help you understand both broad patterns and deep details of your MVT Campaign performance under live routing conditions.
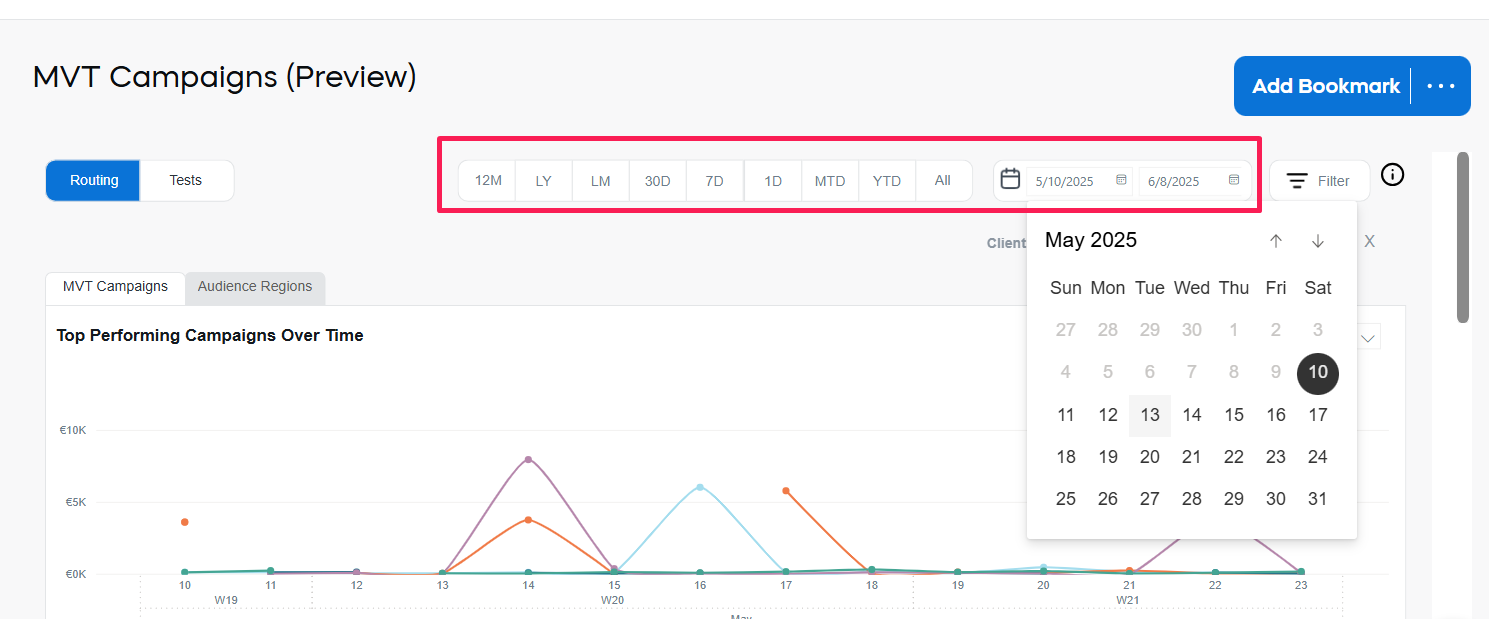
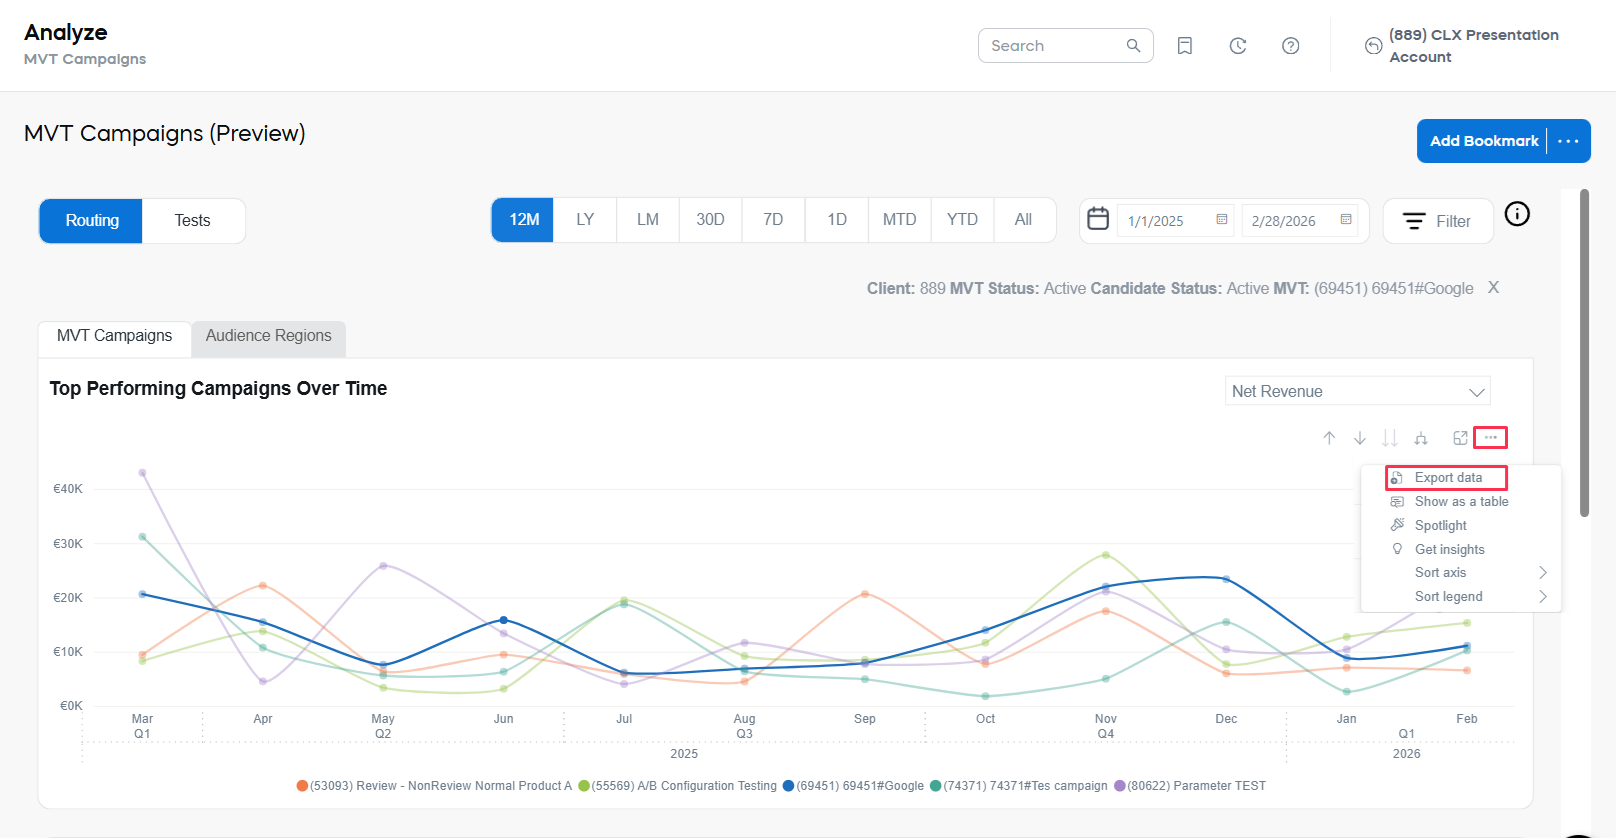
Performance chart
The Performance chart offers a high-level visual overview of your MVT Campaign performance, helping you quickly spot trends, compare key metrics, and identify areas for further analysis.
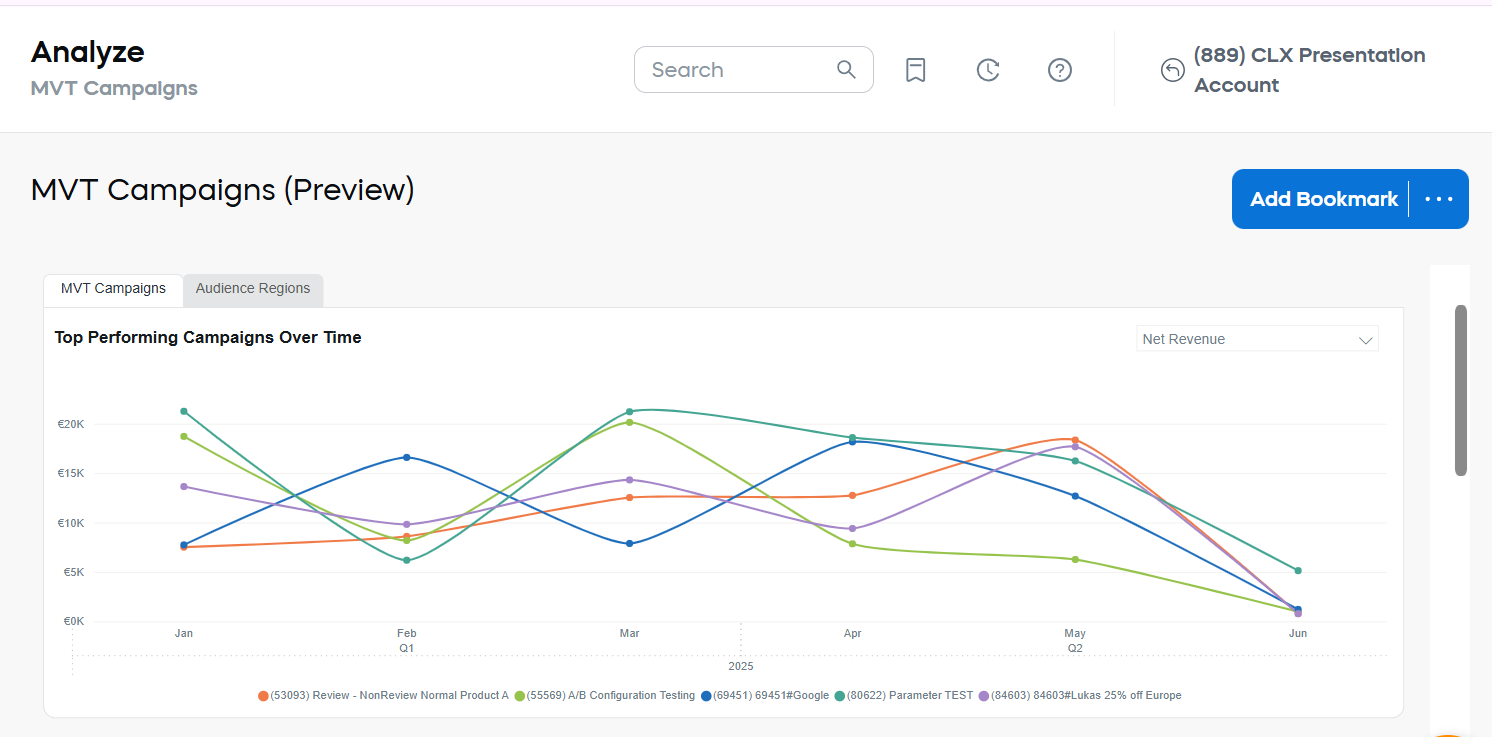
The default view displays the Top 5 MVT Campaigns (if available), ranked by total Net Revenue for the selected period, with performance trends visualized over time.
Use this view to quickly identify which MVT Campaigns are driving the most revenue during the selected period.
Performance chart settings
The Performance chart offers flexible options to tailor your analysis and explore MVT Campaign results from different perspectives. You can adjust both the chart representation and the metric used to define top performance, allowing you to focus on the insights most relevant to your business goals.
Chart representation
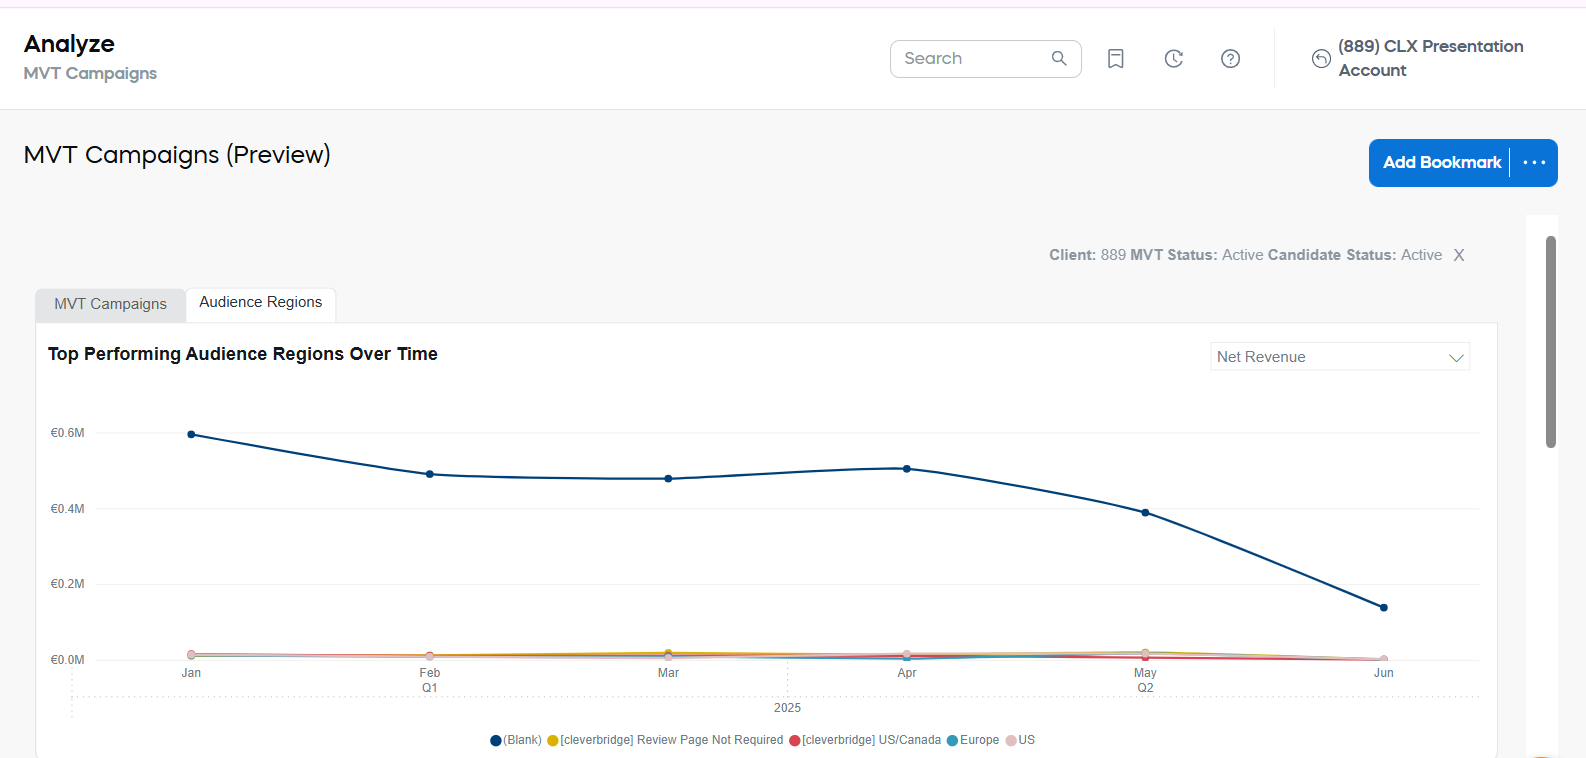
While the default view shows top performing MVT campaigns, you can switch the chart representation to Audience Regions to see which audience regions (as defined in your Audience Settings) have performed the best during the selected period aggregated across all campaigns and candidates.
Metric Options
Regardless of the chosen representation, date range, and filters applied, you can define the metric used to identify the top-performing campaign or audience region.
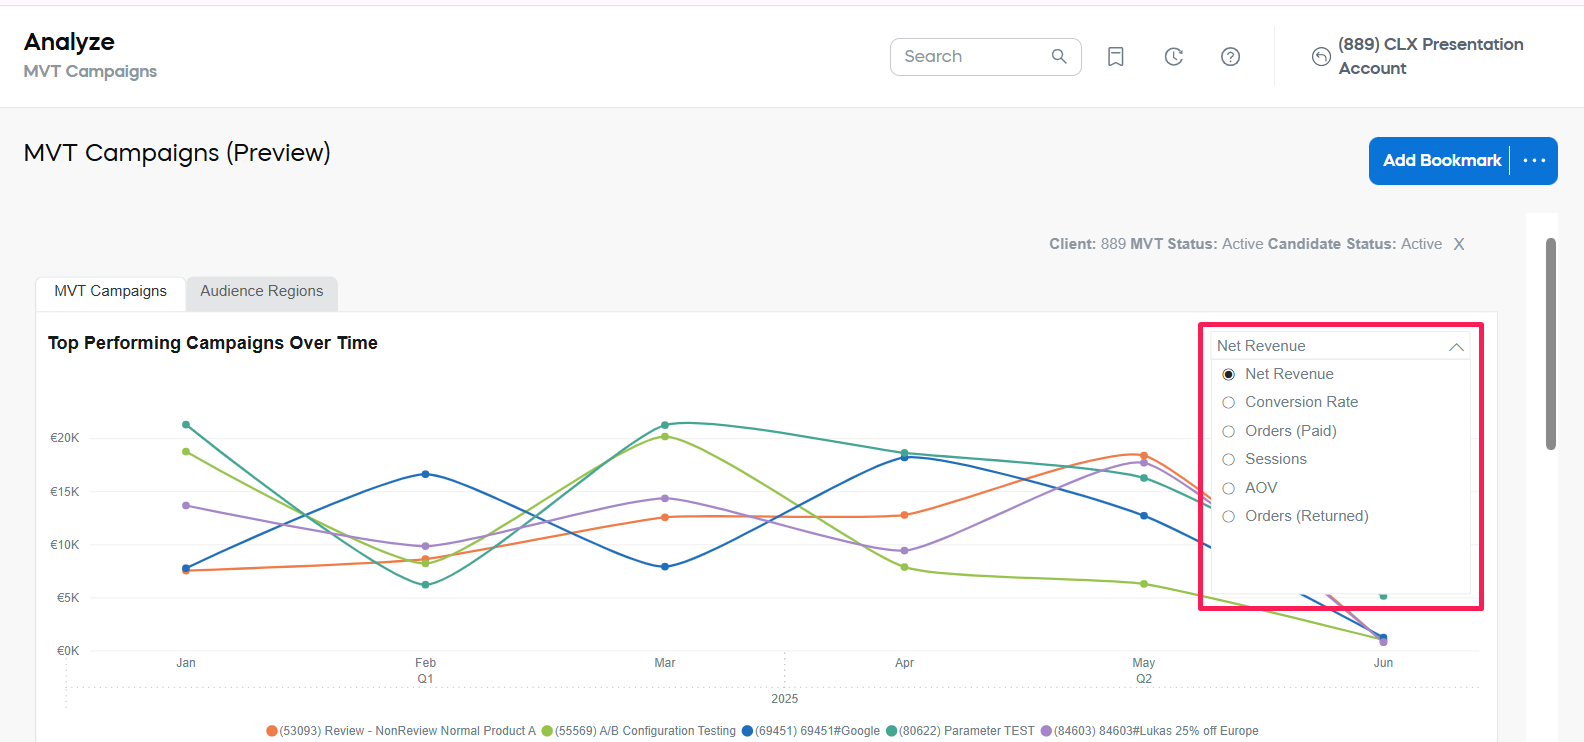
- Net Revenue: Customer Sales Revenue Net, after returns and refunds, displayed in the selected currency. You can switch between currencies using the filter panel.
- Conversion Rate: The number of Paid Orders (before refunds) divided by the number of Sessions. Only orders linked to sessions are counted to ensure accuracy in conversion calculation.
- Orders (Paid): The total number of Paid Orders before returns or chargebacks. This metric shows raw order volume generated by campaigns or regions.
- Orders (Returned): The number of orders that resulted in refunds or chargebacks. Useful for monitoring order quality and understanding refund patterns.
- Sessions: The total number of visitor sessions during the selected period. The sessions are counted regardless of whether they resulted in an order.
- Average Order Value (AoV): The average value of an order, calculated as (Net Revenue after refunds and chargebacks) ÷ (Orders after returns). AoV provides insight into the typical order size and helps assess the value of customer transactions.
- Other settings: You can also adjust the data shown in this view using the Date Selection options and Filters as described at the end of this article.
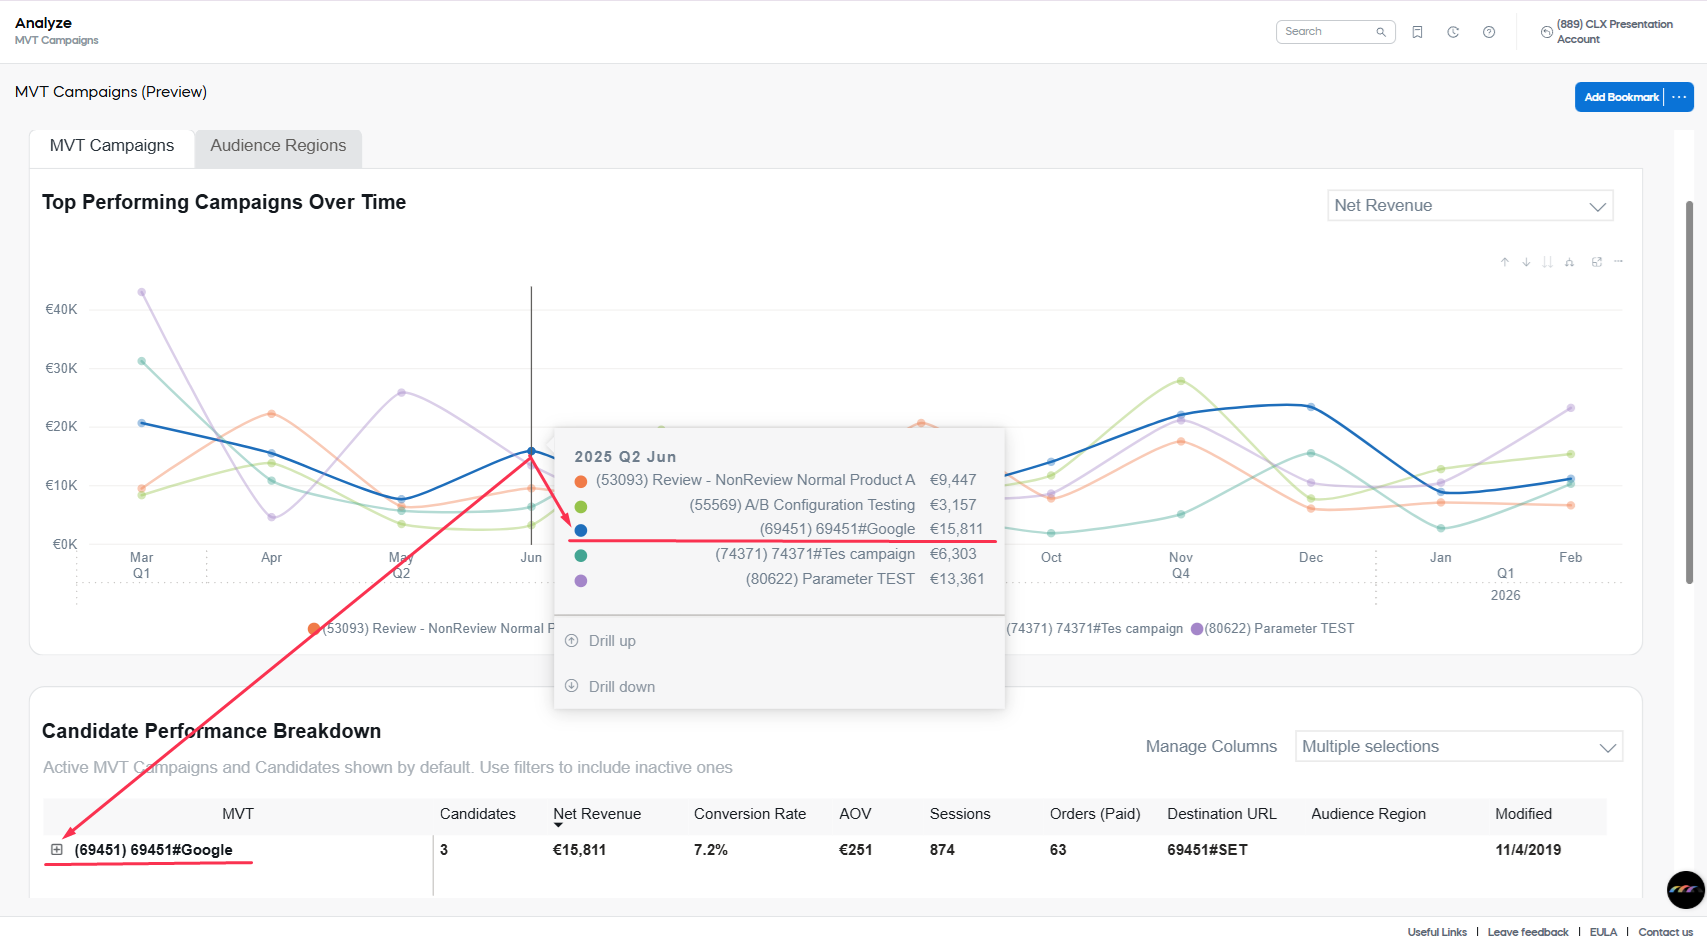
Candidate Performance Breakdown table
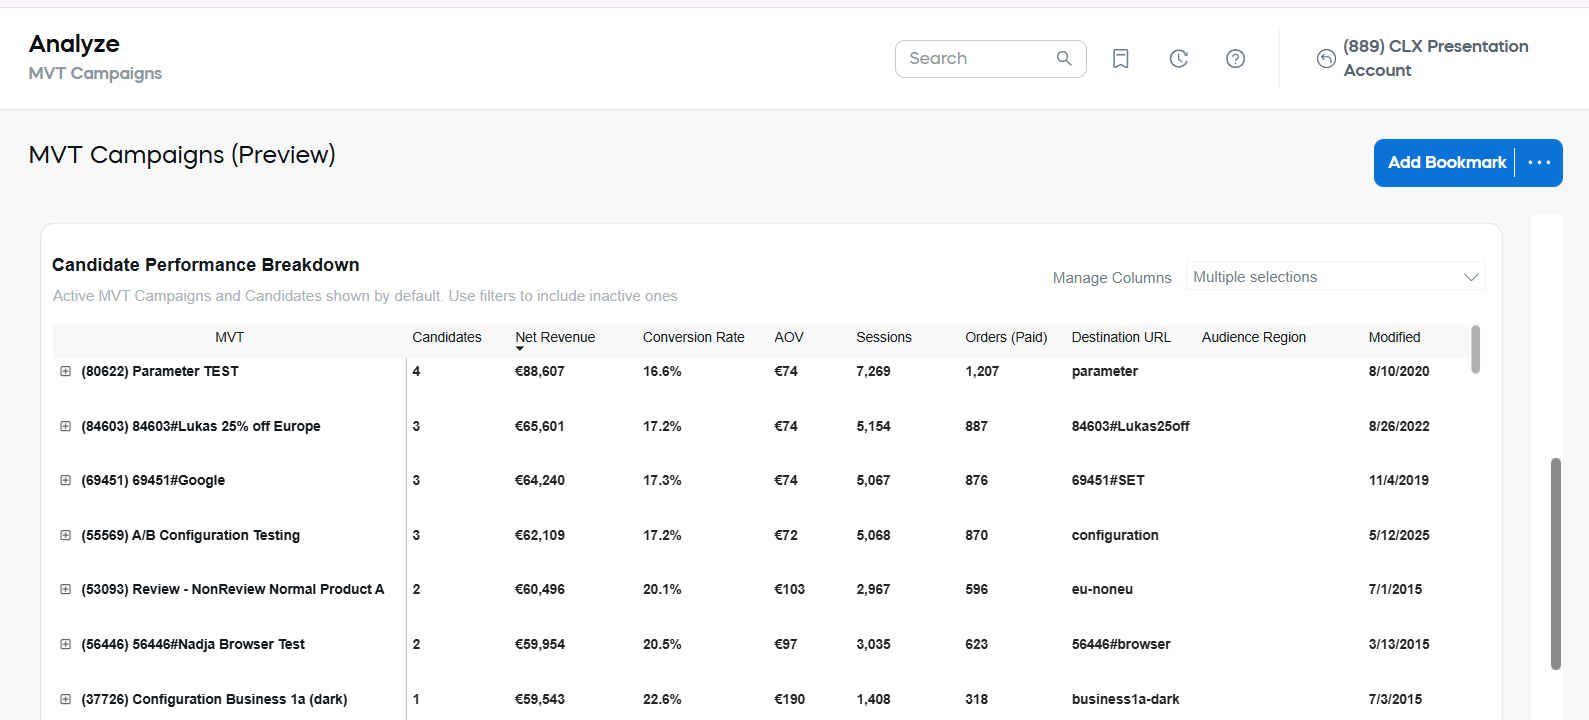
The table below the charts provides a detailed performance breakdown of your MVT Campaigns, with results displayed at both the campaign and individual candidate level.
The table includes only candidates that have generated Net Revenue or Sessions during the selected period, helping you focus on meaningful activity. By default, the results are sorted by Net Revenue in descending order, so your top-performing campaigns and candidates appear first.
Candidate Performance Breakdown table settings
You can customize the table to explore your data in the way that best supports your analysis:
-
Expand each MVT Campaign row to view the performance of its individual candidates.
-
Reorder the table by clicking any column header to sort the data accordingly.
-
Customize which columns are displayed by selecting or deselecting columns in the Manage Columns dropdown.
Default Columns:
- MVT: Displays the ID and Name of each MVT Campaign and its associated candidates.
- Candidates: The total number of candidates within each MVT Campaign that are displayed in the table.
- Net Revenue: Customer Sales Revenue Net, calculated after returns, refunds, and chargebacks.
- Conversion Rate: The number of Paid Orders (before refunds) divided by the number of Sessions. Only orders linked to sessions are included in this calculation.
- Average Order Value (AoV): Net Revenue (after refunds and chargebacks) divided by Orders after returns. This metric reflects the average value of an individual order.
- Sessions: The total number of visitor sessions during the selected period.
- Orders (Paid): The number of Paid Orders recorded, prior to any returns or chargebacks.
- Destination URL: The URL of the checkout flow associated with each candidate. Provides a direct reference to the version of the checkout experience customers were routed to.
- Audience Region: The Audience Region assigned to the candidate, as defined in the MVT Campaign’s Audience Settings.
- Modified: The date when the MVT Campaign or Candidate was last modified.
Additional Available Columns (use "Manage Columns" dropdown to add):
- Test: Indicates whether the MVT Campaign currently has an active test running. Helps distinguish between routings used purely for segmentation and those being tested.
- Status: The current status of the MVT Campaign or Candidate (Active or Inactive). Especially useful when including Inactive items in your analysis.
- MVT URL: The URL associated with the MVT Campaign. Useful for validating campaign routing and testing configurations.
- Orders (Returned): The number of orders that resulted in refunds or chargebacks. Helps monitor order quality and identify refund trends.
- Orders (Aggregated): The net number of orders, calculated as Orders (Paid) - Orders (Returned). Provides a quick view of retained order volume after accounting for returns.
noteColumns appear in the order they are selected—so if you uncheck a column and then add it back, it will appear at the end of the table.
-
Other settings: You can also adjust the data shown in this view using the Date Selection options and Filters, and use other tools such as table export, as described at the end of this article.
Tests Mode
The Tests Mode in MVT Campaign Analytics provides a dedicated view for analyzing the results of controlled MVT Tests. This helps you evaluate how different checkout variants perform when tested against a Control Candidate, so you can make informed decisions about which versions deliver the best outcomes.
In MVT Campaigns, a Test is defined as a routing configuration that includes a Control Candidate and at least one additional Test Candidate (variant).
During the test, customers within the same Test Audience (defined by Audience Region, Browser, Operating System, and Language) are randomly assigned to either the Control or a Test Candidate based on the configured traffic split. Only one Control Candidate can be active within a Test at any given time.
When the Test Mode is selected, a Test appears only when there is at least one Test Candidate in addition to the Control Candidate. Routings that contain only a Control Candidate are not treated as Tests and do not appear in this view.
The page contains:
- Test Performance for Selected MVT Campaign: A table that displays performance metrics for each Control Candidate and Test Candidate, grouped by Test Audience. This view helps you compare variants side by side and assess their impact on key business outcomes.
- Explore Performance Drivers (Deep Performance Analysis): An interactive tool that allows you to drill down into candidate performance across different dimensions, such as Region, Country, Product, Operating System, and Browser. Use this view to uncover the root causes of performance differences and identify optimization opportunities.
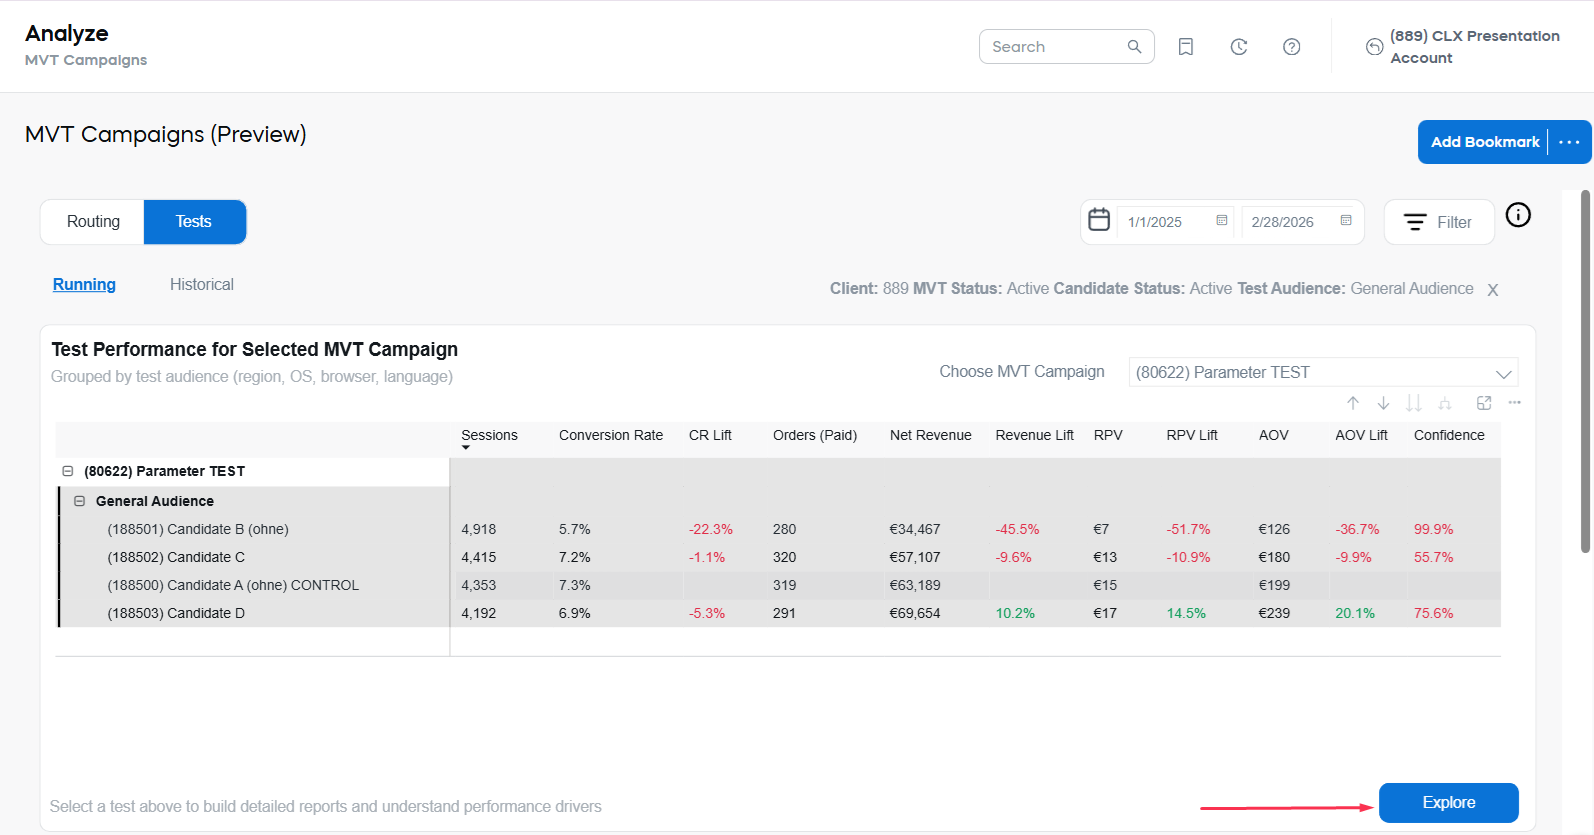
Test Performance for Selected MVT Campaign
By default, the table displays the best-performing MVT Campaign with active tests, grouped by Test Audience. Within each audience group, the table shows the Control Candidate (marked as CONTROL) and all corresponding Test Candidates, enabling clear side-by-side comparison of performance metrics.
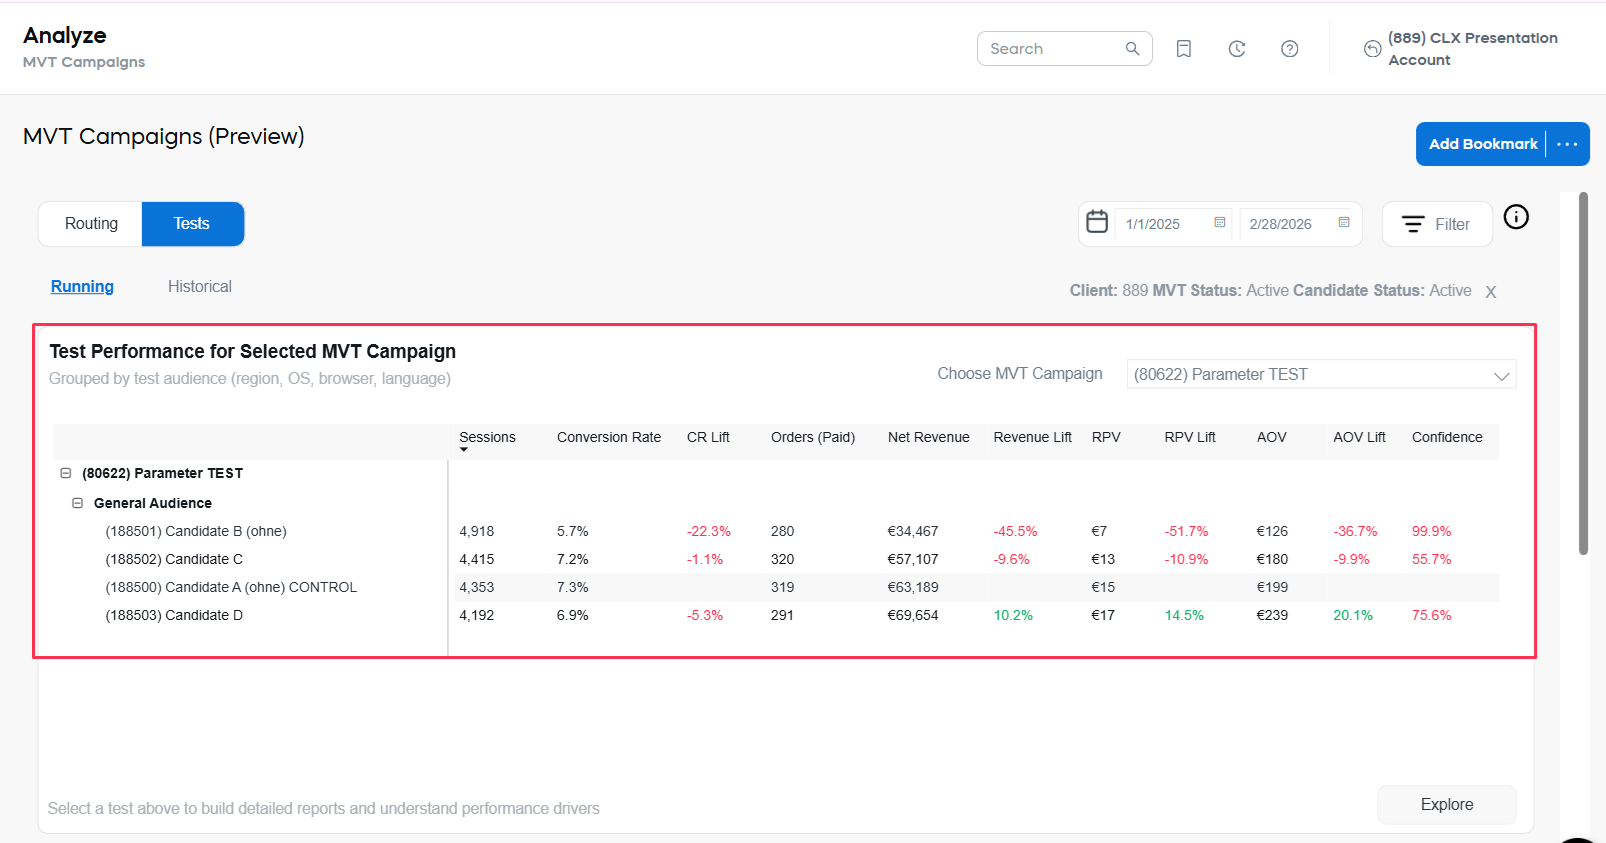
Metrics highlighted in green indicate that the candidate is outperforming the Control for that metric, while metrics highlighted in red indicate underperformance. Use these visual cues to quickly spot where candidates are winning or falling behind.
Results are initially sorted by Net Revenue (highest to lowest), but you can click any column header to reorder the table based on your preferred metric.
-
Sessions: Total number of visitor sessions recorded for each candidate during the reporting period.
-
Conversion Rate: The number of Paid Orders (before returns) divided by the number of Sessions. Reflects the percentage of sessions that resulted in a paid order.
-
Orders (Paid): The total number of Paid Orders generated, prior to any returns or chargebacks.
-
Net Revenue: Total revenue after accounting for refunds and chargebacks.
-
Revenue Lift: The percentage difference in Net Revenue compared to the Control Candidate. Indicates how much more or less revenue a test candidate is generating relative to the control.
-
RPV (Revenue Per Visitor): Net Revenue divided by the total number of Sessions. Measures the average revenue generated per visitor.
-
RPV Lift: The percentage difference in RPV compared to the Control Candidate.
-
Average Order Value (AoV): Net Revenue divided by the number of Paid Orders. Represents the average value of an individual order.
-
AoV Lift: The percentage difference in AoV compared to the Control Candidate.
-
Confidence: The statistical confidence level of the results. Indicates the probability that observed differences between candidates and the control are not due to random chance.
Confidence ranges:
- Below 80%: Results may be due to random variation; more data is needed before drawing conclusions.
- 80–90%: Moderate confidence; emerging trends are visible, but findings are not yet definitive.
- 90–95%: High confidence; results are likely valid and can be used to guide decisions.
- Above 95%: Very high confidence; results are statistically significant and highly reliable.
Lift calculations always compare against the current ACTIVE Control candidate.
Even when viewing inactive candidates, they will be compared with the active Control.
Test Performance for Selected MVT Campaign table settings
The default view shows only active Control Candidates, active Test Candidates, and only active MVT Campaigns are available for selection. You can use the MVT Campaign Selection dropdown to select a specific campaign.
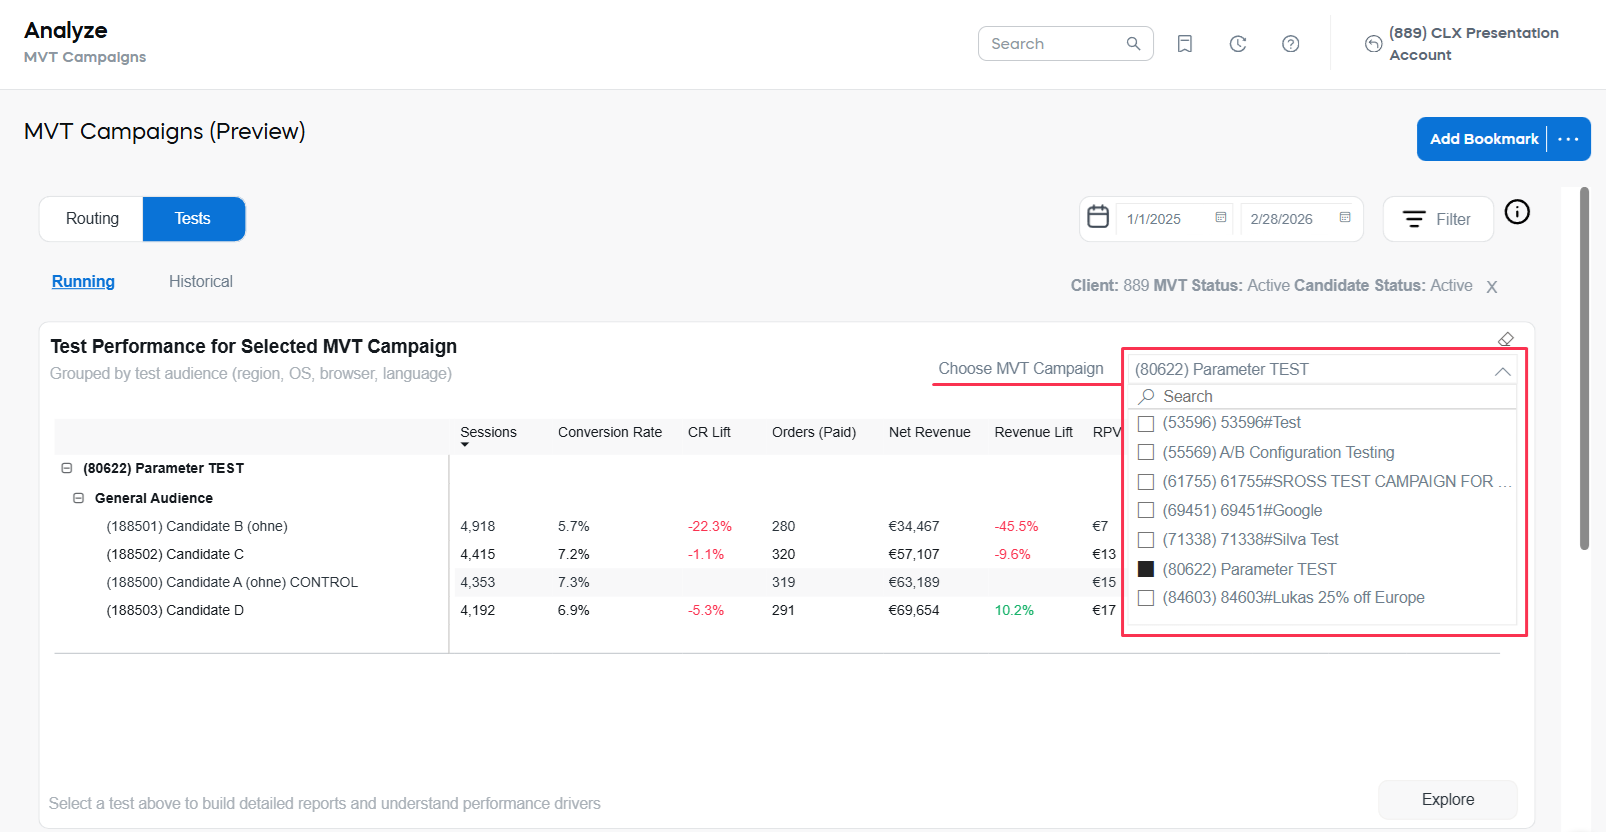
You can also adjust the data shown in this view using the Date Selection options and Filters, and use other tools such as table export, as described at the end of this article.
Explore Performance Drivers (Deep Performance Analysis)
The Explore view provides advanced tools for deep analysis of candidate performance within a selected test. It helps you understand where and why certain candidates outperform or underperform the control across different dimensions. When you explore an individual test, the view also includes a Candidate activity timeline that shows when each candidate was active during the selected reporting period. This helps you choose a meaningful date range for evaluating test results.
To access the view, select the test or campaign you want to analyze in the Test Performance Overview table, then click the Explore button.
The Explore button is active if you select one entry in the table - it can be a child or a parent entry of any level.
For the sake of example we will select a whole campaign.
Candidate activity timeline
At the top of the Explore view, the timeline shows when the control and test candidates were active during the selected date range.
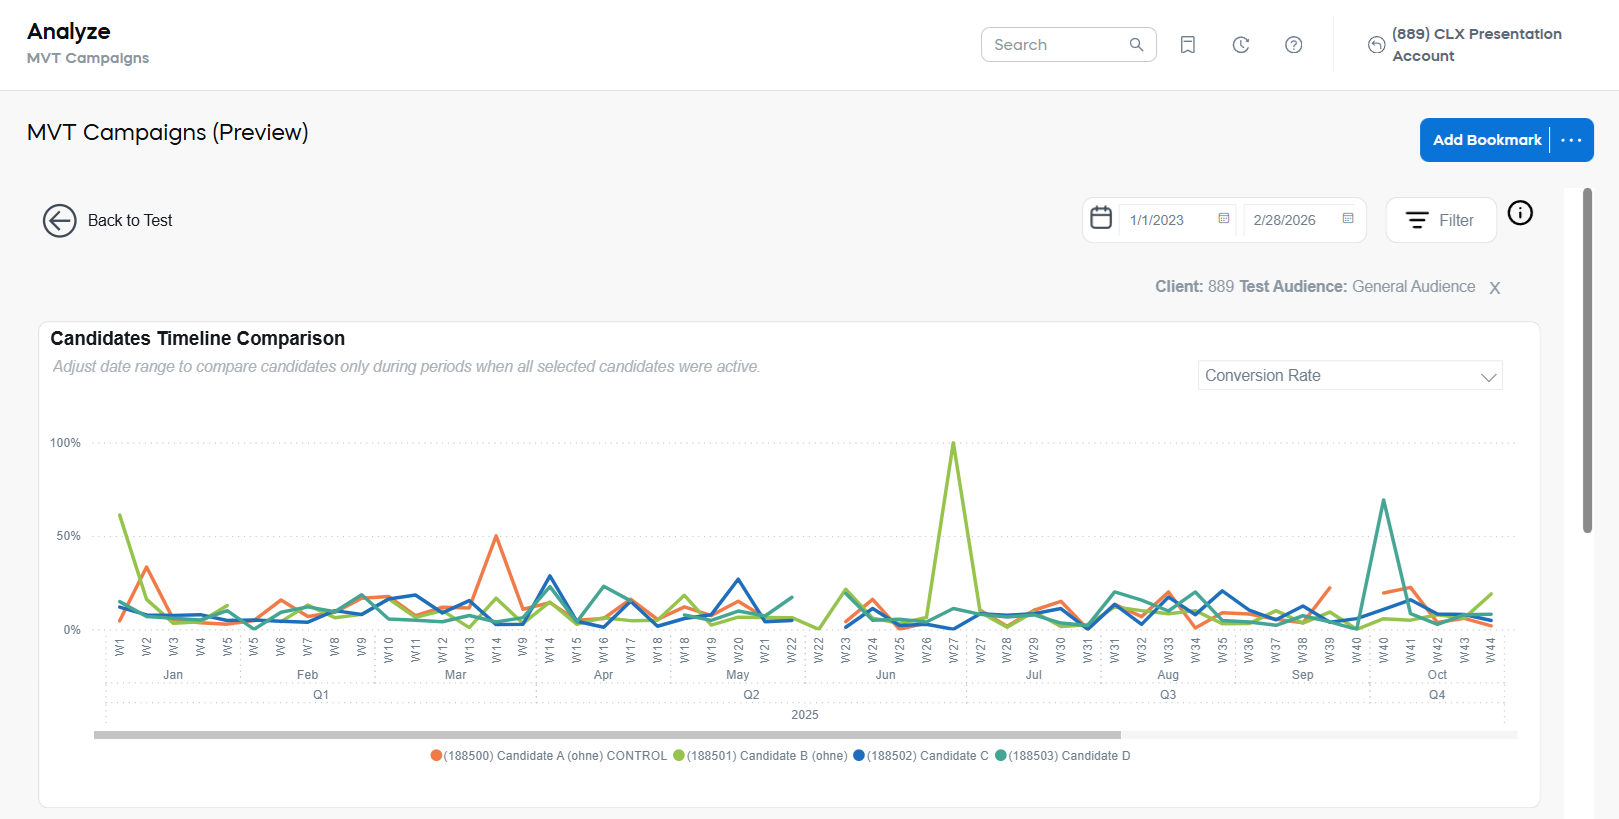
Use this chart to:
- See the period when all candidates in the test overlapped and were active at the same time.
- Identify dates when some candidates were deactivated or newly activated.
- Adjust the reporting period so that you analyze results only for the time when multiple candidates were simultaneously active.
If you see extreme lift values (for example, Revenue Lift or CR Lift above 1,000%), this usually means that the date range includes days when only one candidate remained active. In this case, use the Activity Timeline to find the last date when multiple candidates were active, and then change the report End date accordingly. You can also drill-down to see more precise data.
Explore Performance Drivers table: Structure and Behavior
The table displays the performance grouped by dimension.
It includes the dimensions used for grouping (by default, the Total dimension is chosen), name of the candidate, and the performance details (Net Revenue, AoV, etc.).
- When a whole campaign is selected, you will see all candidates listed for the selected dimension.
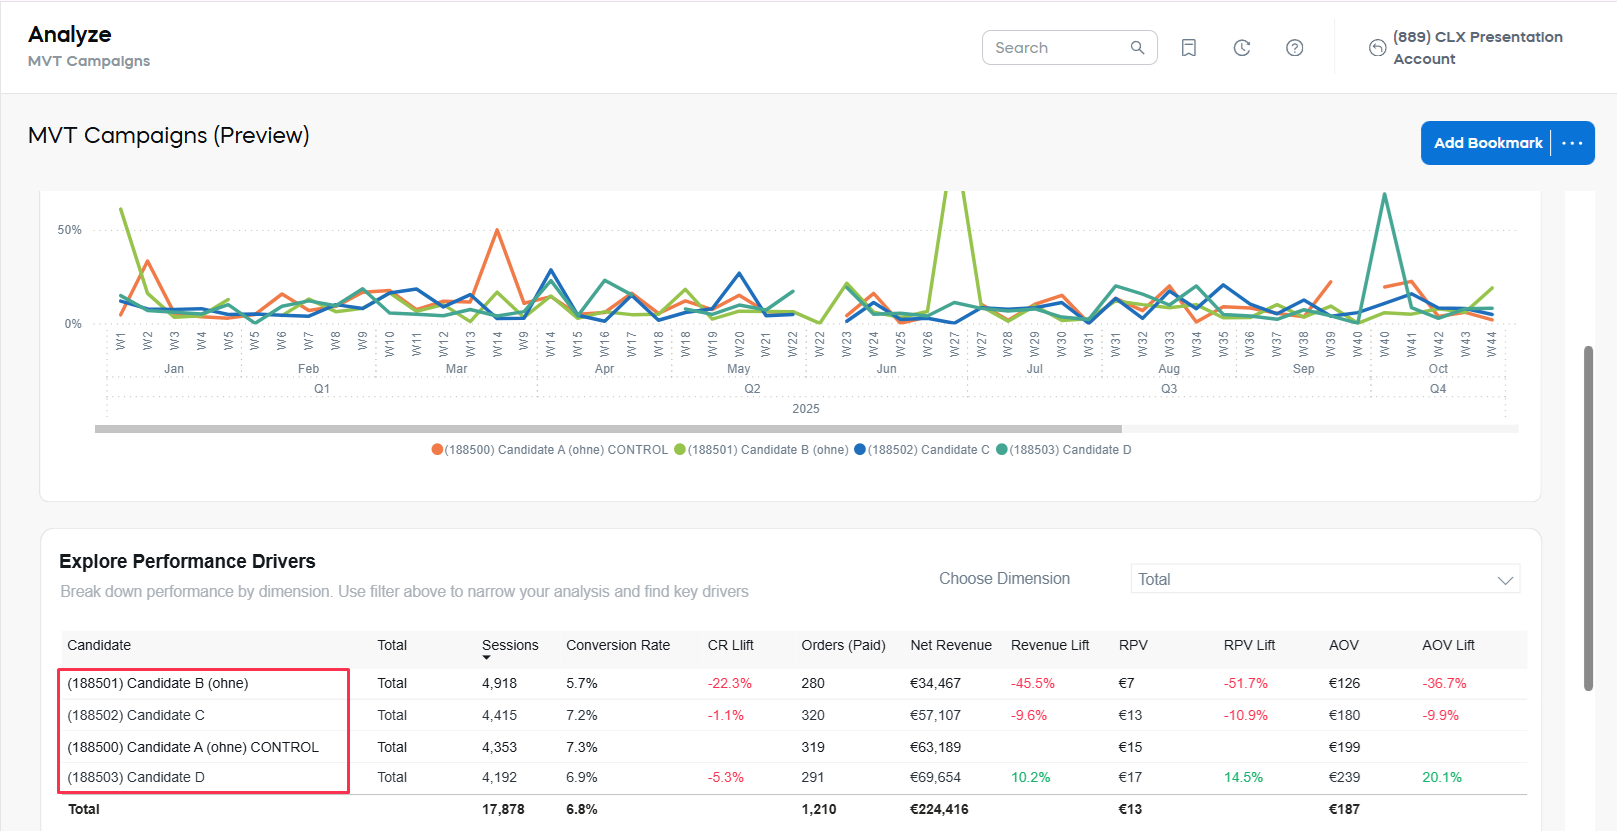
- When a specific candidate is selected, you will see only that candidate’s performance across the selected dimension.
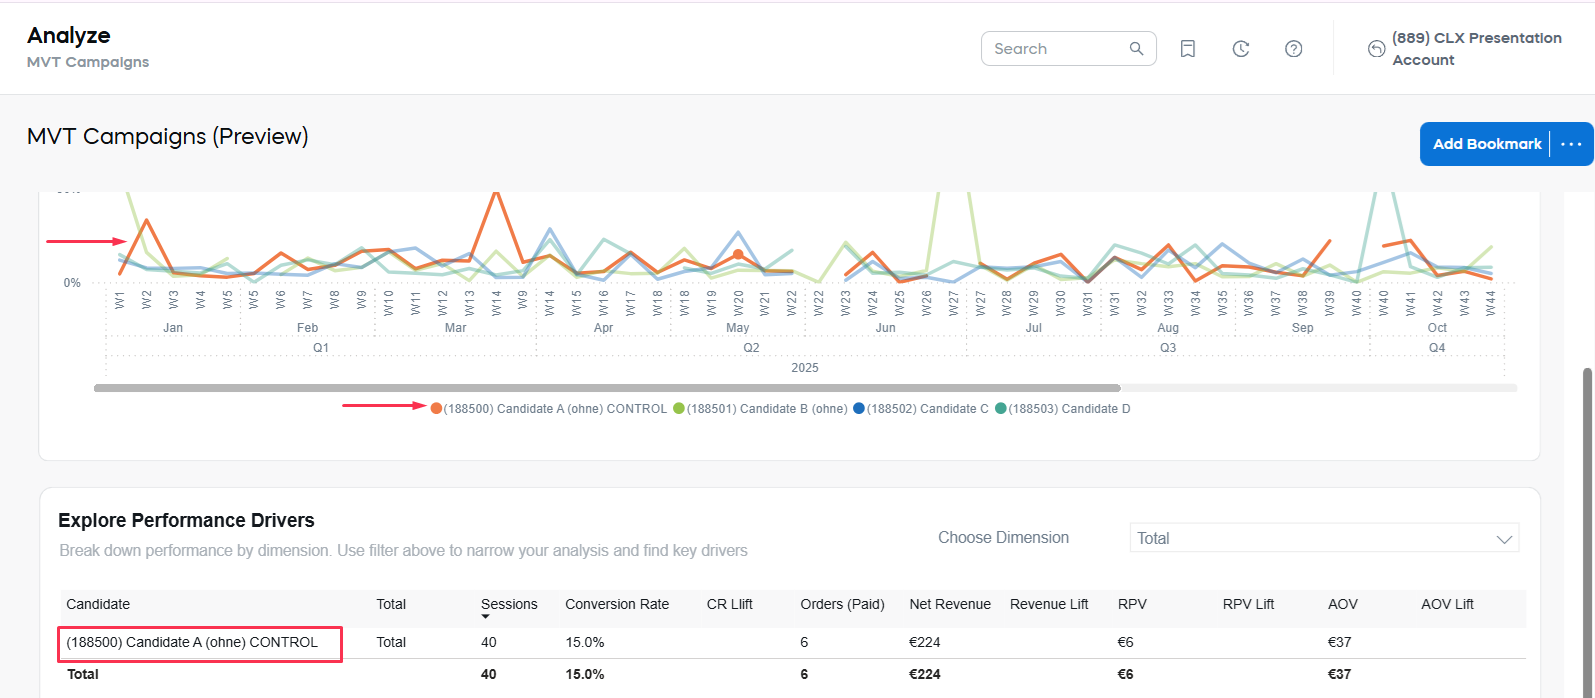 tip
tipYou can select the whole campaign or a specific candidate at the Test Performance for Selected MVT Campaign level, or by clicking the desired item in the Explore Performance Drivers table.
- Candidate: The candidate being analyzed.
- Dimensions: The selected dimensions, (for example, Total, Region, or Country). The full list of available dimensions is described in Explore Performance Drivers table settings.
- Sessions: Total number of visitor sessions.
- Conversion Rate: Paid Orders divided by Sessions. Reflects the percentage of sessions that resulted in a paid order.
- CR Lift (Conversion Rate Lift): The percentage difference in Conversion Rate compared to the Control Candidate.
- Orders (Paid): Total number of paid orders, before refunds or chargebacks.
- Net Revenue: Total revenue after refunds and chargebacks.
- Revenue Lift: The percentage difference in Net Revenue compared to the Control Candidate for the same dimension value.
- RPV (Revenue Per Visitor): Net Revenue divided by Sessions. Measures the average revenue generated per visitor.
- RPV Lift: The percentage difference in RPV compared to the Control Candidate.
- Average Order Value (AOV): Net Revenue divided by Orders (Paid). Represents the average value of an individual order.
- AOV Lift: The percentage difference in AOV compared to the Control Candidate.
Explore Performance Drivers table settings
The Explore Performance Drivers table allows you to analyze candidate performance across different dimensions. This helps you uncover patterns and variations in how test candidates perform for specific customer segments.
You can adjust the dimension displayed in the first column of the table by using the Choose Dimension dropdown.

You can switch dimensions at any time to explore different aspects of performance. The rest of the table columns remain consistent and update automatically based on your selected dimension.
-
Total: Aggregated results for all sessions and orders, without applying any dimension.
-
Region: The audience region as defined in your Audience Settings.
-
Product: The product or service included in the order.
-
Product List: The product list configured for the routing, for example, a specific catalog or offer set.
-
Operating System: The customer’s device operating system.
-
Browser: The customer’s browser type.
-
Country: The country based on the customer’s session location.
noteSession country may differ from Billing Country, which can cause differences in Session and Conversion Rate counts by Region or Country (in some cases, Conversion Rate may exceed 100% because of that).
You can also adjust the data shown in this view using the Date Selection options and Filters, and use other tools such as table export, as described at the end of this article.
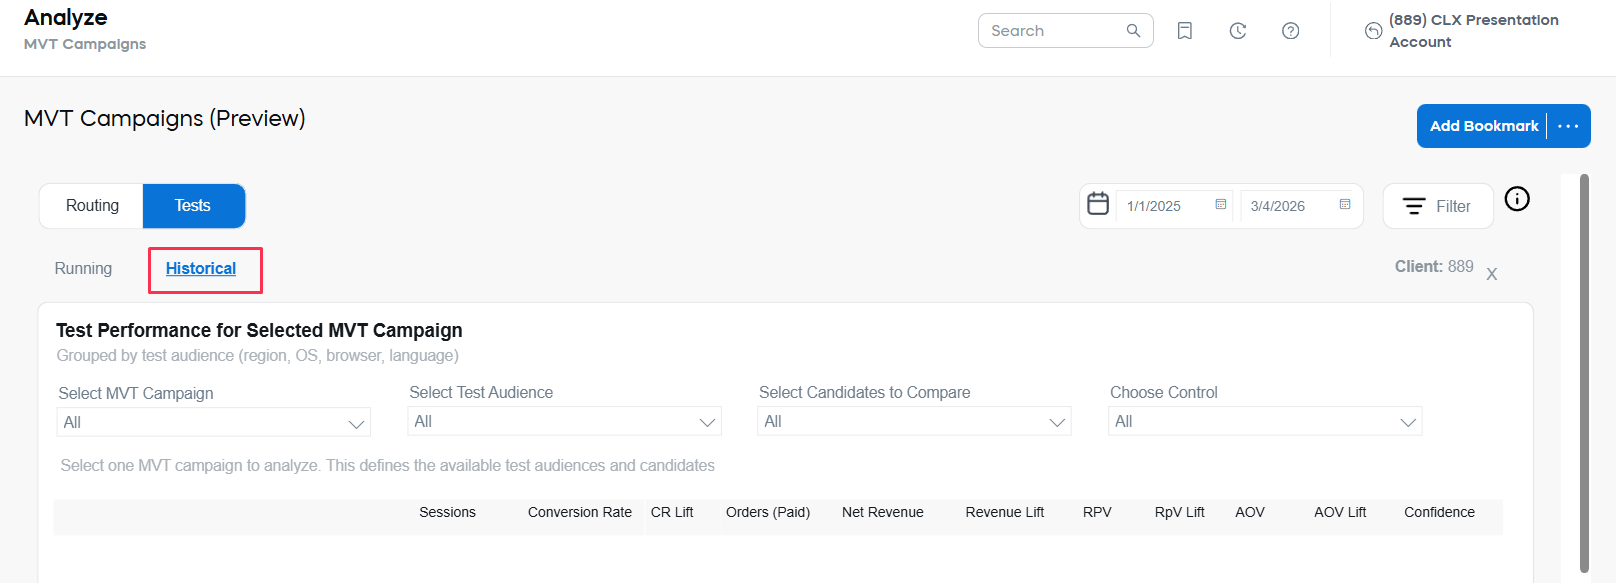
View historical test data
In the default (Running) mode of the Tests data, a test is recognized only when there is a defined control candidate and at least one test candidate (variant). If a control was removed, changed, or the routing was edited after the test ran, the test might not appear in the standard test view because the system can’t determine what should be compared. Use the Historical tab to manually reconstruct the comparison for a past period.
To view historical results:
-
In Analyze > MVT Campaigns, select Tests, and then select Historical.
-
Select a date range that includes the period you want to analyze.
-
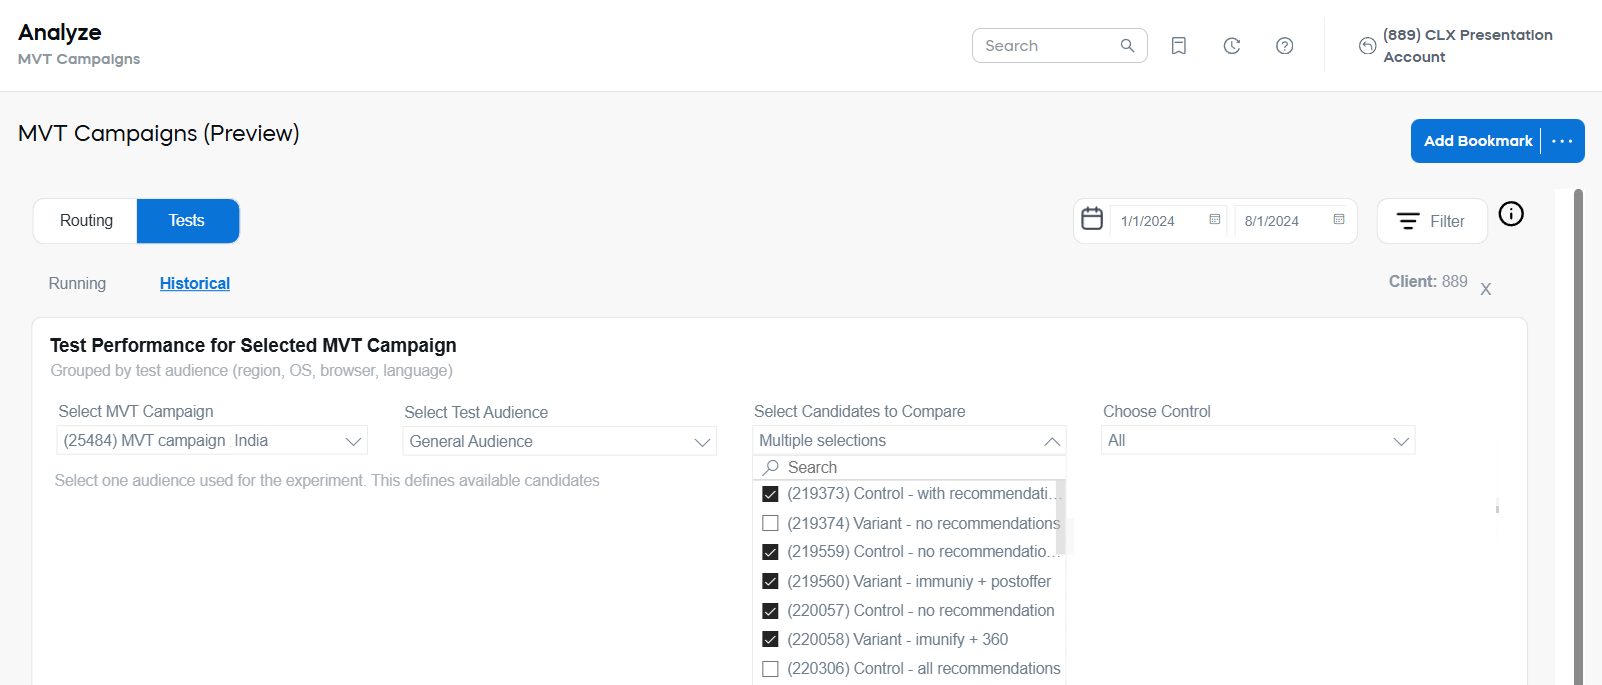
From Select MVT Campaign, choose the campaign you want to review.
-
From Select Test Audience, choose the audience to analyze.
-
From Select Candidates to Compare, select the candidates you want to compare.
-
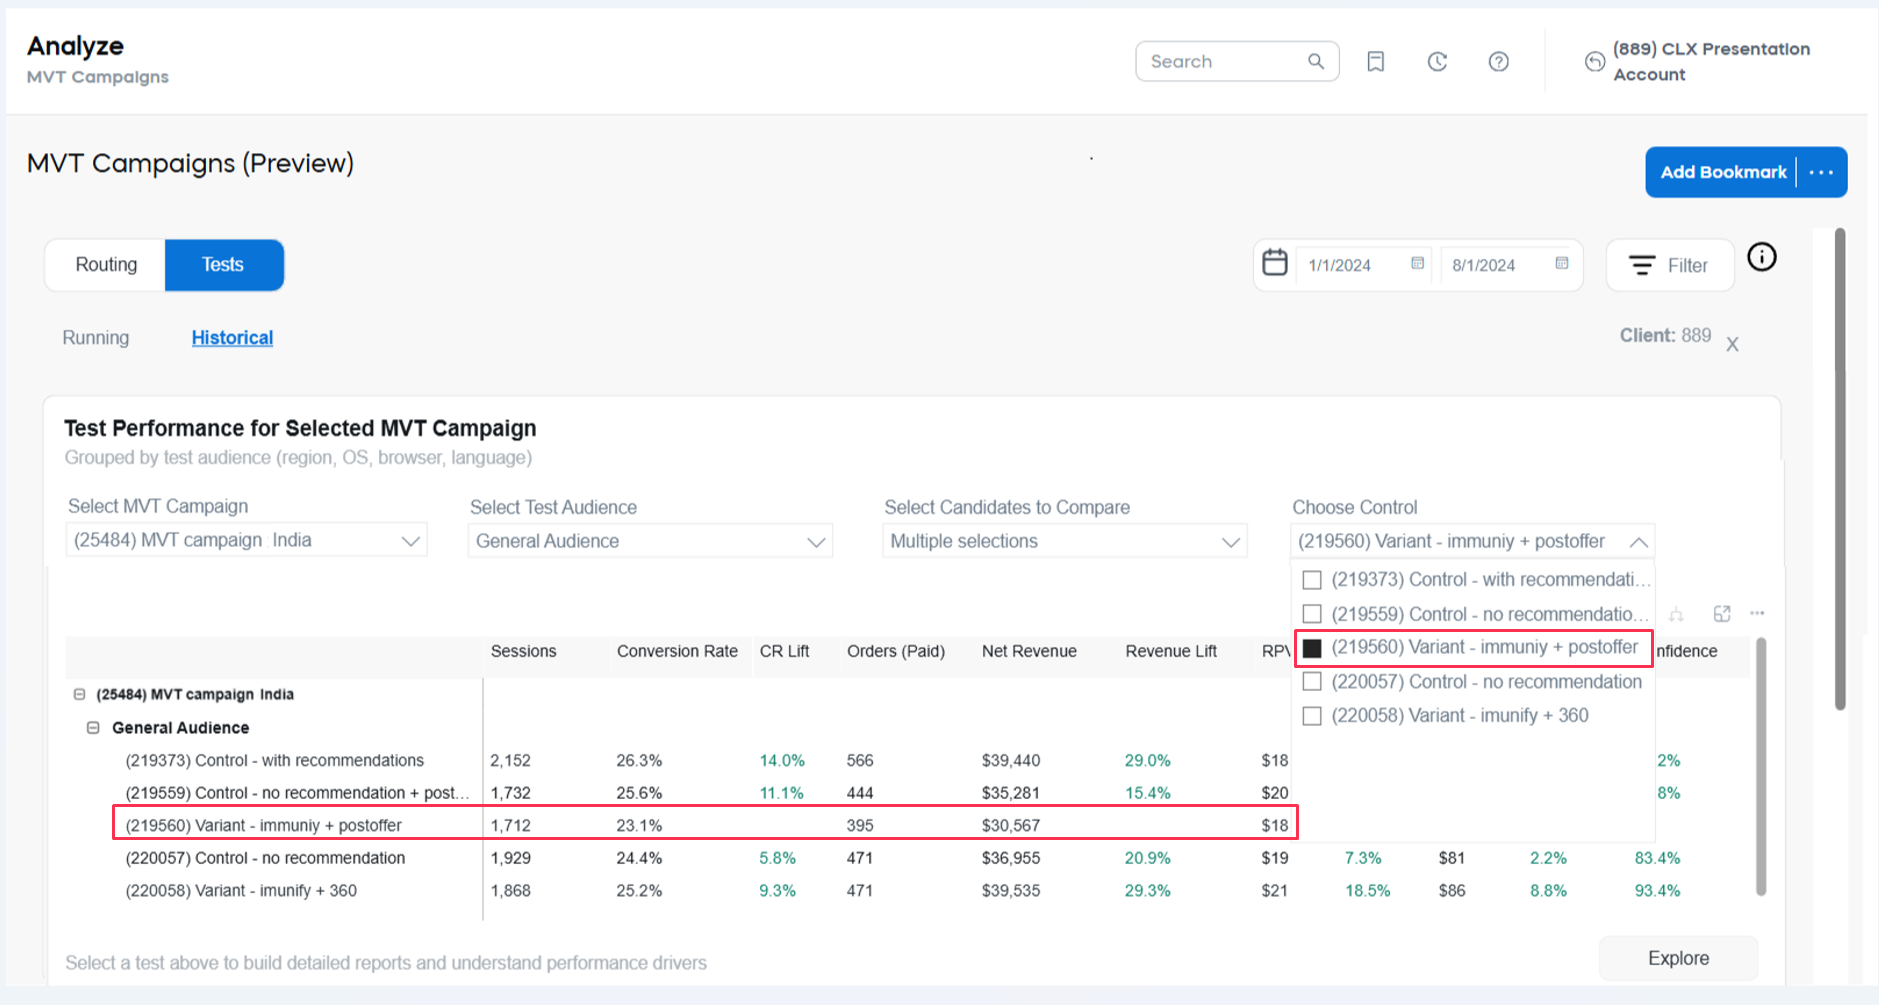
From Choose Control, select which of the selected candidates should act as the control baseline for lift calculations. After you choose a control, lift metrics (for example, Revenue Lift and CR Lift) are calculated against that selected control candidate.
You can select any of the candidates as a control, regardless of its role in the campaign.
Historical data is tied to the candidate ID. If a candidate was renamed, it still appears as a single candidate, and the UI shows the latest candidate name.
Return to the Test Performance page
Use Arrow Back to return to the Test Performance page.

Filters
Regardless of the selected chart representation or table, you can refine the data displayed using the Filters panel. Applying filters allows you to focus your analysis on specific campaigns, candidates, audiences, or customer segments, making it easier to uncover actionable insights and tailor your reporting to your business needs.
Available filters include:
-
Client: Select the Client account to be analyzed (useful if you have access to multiple clients). The logged-in user's Client is selected by default.
-
MVT Campaign: Select specific MVT Campaigns to analyze, or choose All to include all available campaigns.
-
MVT Campaign Status: Choose whether to include Active, Inactive, or All campaigns.
-
Control Status (Available only in the Test mode): Filter by Control status of test candidates.
-
Candidate: Focus the analysis on a particular Candidate, or select All to include all Candidates.
-
Candidate Status: Choose whether to include Active, Inactive, or All candidates.
-
Audience Region: Filter the analysis by regions defined in your Audience Settings.
-
Billing Region, Country: Filter performance by the customer’s billing location (Region and Country).
noteSession country may differ from Billing Country, which can result in inconsistencies in Session and Conversion Rate counts by Region or Country.
-
Product: Filter by specific products or services.
noteSingle orders can contain multiple products. When viewing Orders by Products, counts represent orders containing each specific product, so totals may exceed overall order counts.
-
Payment Type, Subtype: Filter by the payment method used by the customer.
notePayment type data is not always available for sessions. As a result, Conversion Rate by Payment Type may be less reliable due to many "Unknown" entries.
-
Operating System: Filter by the customer’s device operating system.
-
Browser: Filter by the customer’s browser type.
-
Recurrence: Filter by transaction type: Subscription or One-time Purchase.
-
Currency: Select the currency in which revenue-related metrics are displayed (For example, EUR or USD). The Main Client’s currency is selected by default.
By default, only Active MVT Campaigns and Active Candidates are included in the report chart and table. To include Inactive campaigns or candidates in your analysis, adjust the MVT Campaign Status and Candidate Status filters accordingly.
Other data adjustment tools
The other settings include:
-
date adjustments
-
table export
-
data drill-down and filtering
To learn more about additional filter and tools available on the analytics dashboards see the corresponding document.