Multi-item analytics
The Analyze > Multi-Item dashboard provides insights into subscription behaviors involving multiple products or varying item combinations. This is particularly useful for understanding how bundled offers, tiered subscriptions, and multi-item purchase patterns contribute to your business performance.
This dashboard help you analyze key indicators such as net revenue and subscription orders, broken down by product mix or subscription option. You can track which combinations are most popular, identify high-performing configurations, and compare current performance to historical benchmarks.
Multi-Item provides data to be used only as a reference. If you want to generate reports for accounting purposes, use the clearing reports available in Commerce Assistant.
Access multi-item analytics
You can access the multi-item analytics reports in the Analyze > Multi-Item dashboard after you successfully complete the onboarding process. For more information, contact Client Experience.
Multi-item metrics and reports
The following metrics and their representations can help you evaluate business performance at a granular level, identify trends, and support your strategic decision-making with data-driven insights.
Product bundles are not treated as multi-Item orders and therefore are not reflected on the dashboard. This is because all products in a bundle share a single bundle ID and do not retain their individual product IDs.
Net revenue
Net revenue is the amount earned from different product mixes or subscription options after subtracting any applicable discounts and shipping costs, including Cleverbridge fees and affiliate commissions.
In the Analyze > Multi-item dashboard, net revenue can be displayed for:
-
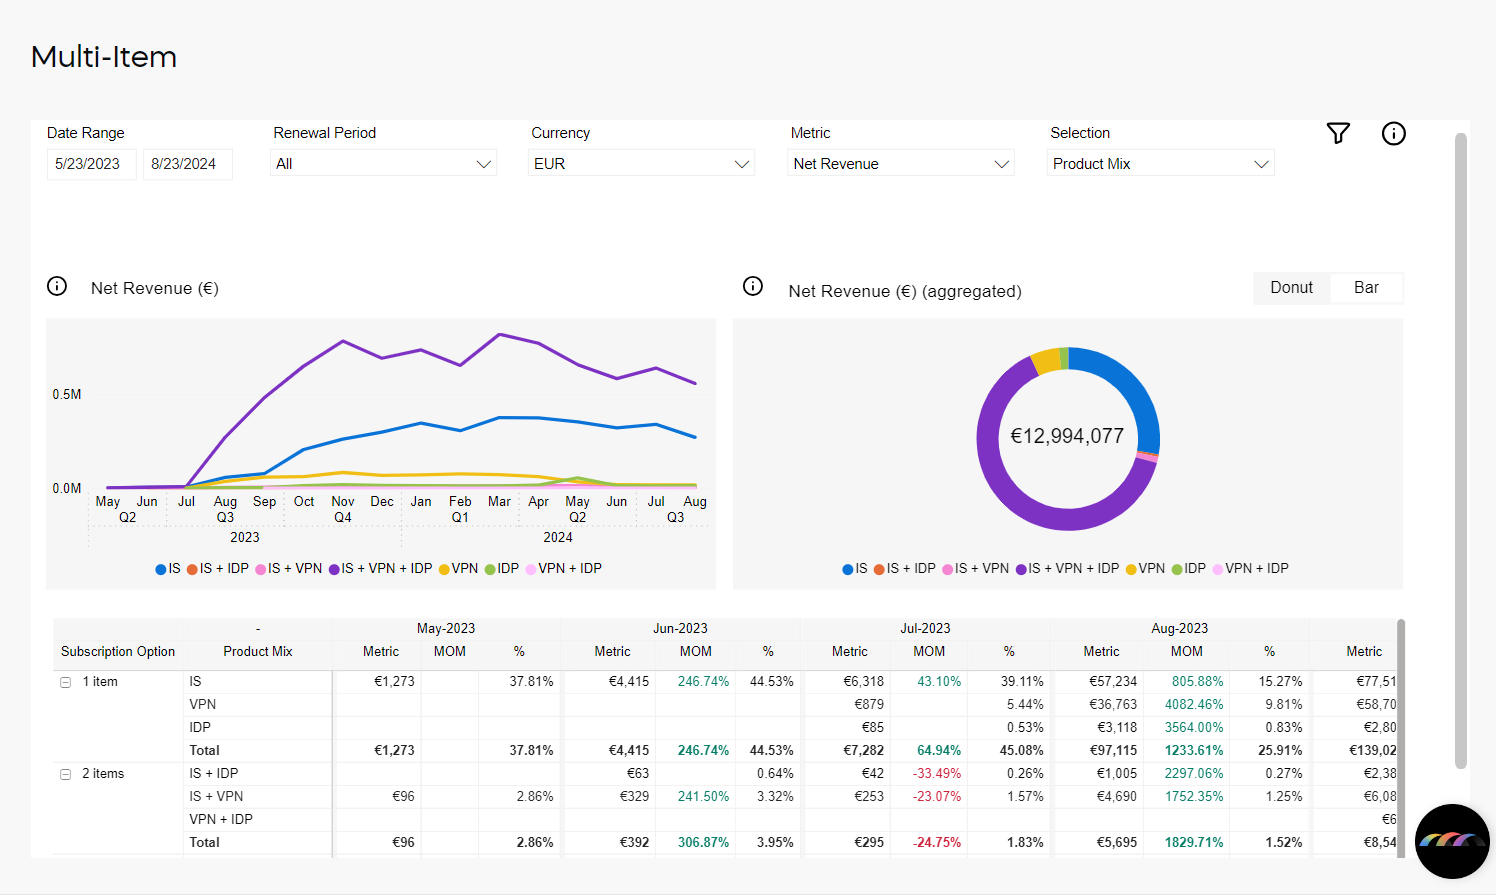
Product Mix: Shows net revenue earned as per different product mixes.
-
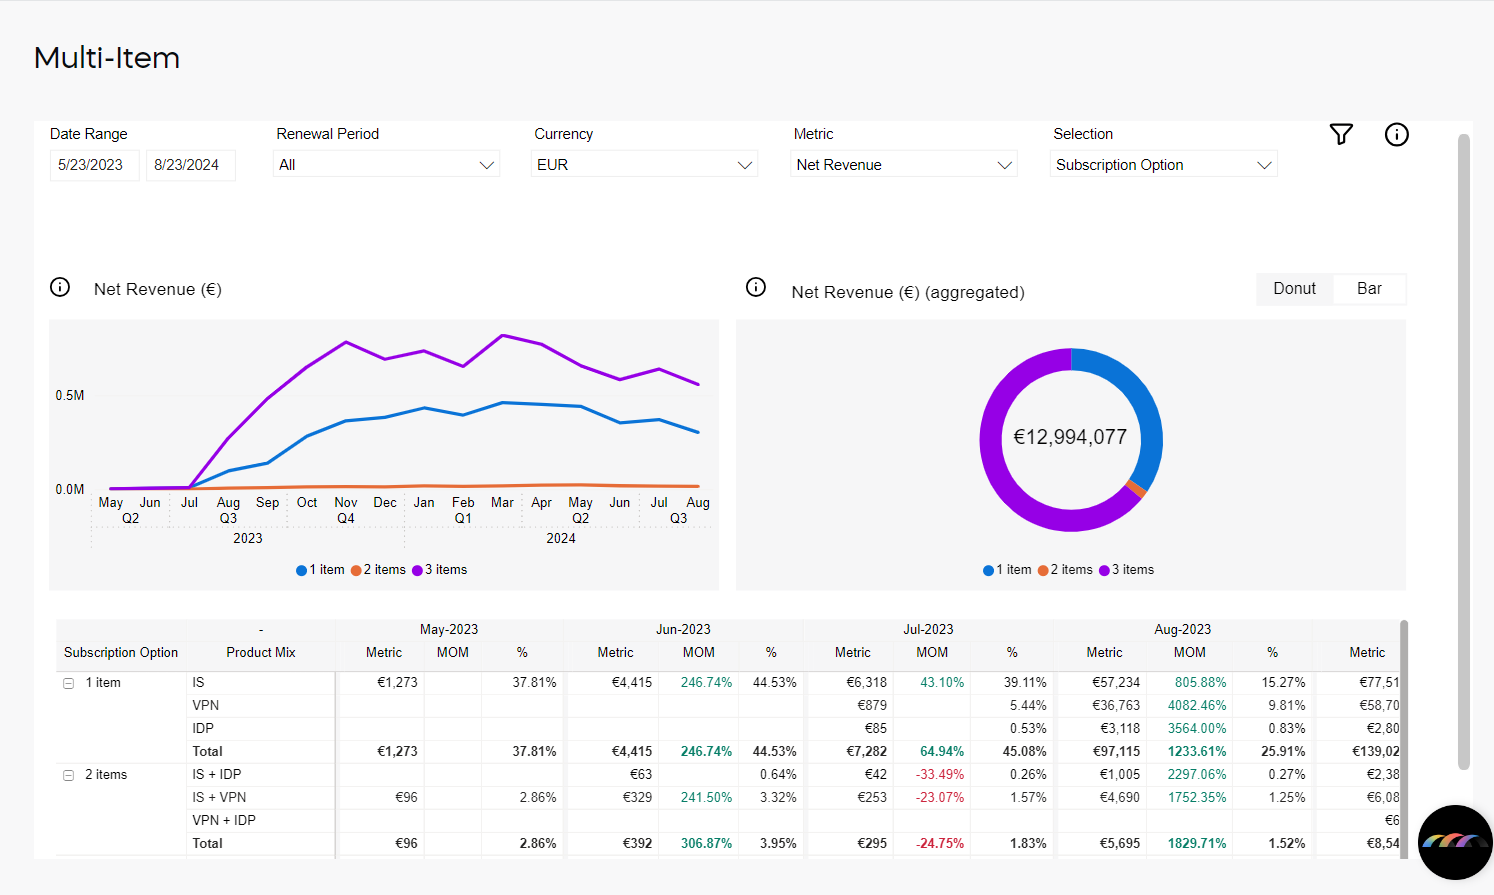
Subscription Option: Shows net revenue earned as per different subscription options.
There are three ways in which the net revenue metric is presented:
- Line chart: Shows net revenue over time for different subscription options or product mixes. You can view data monthly, daily, or yearly, and drill down for details. The x-axis shows the time period; the y-axis shows net revenue.
- Donut chart: Displays the share of net revenue by product mix or subscription option. Each segment represents a different combination. Hover to see more details and identify top-performing mixes.
- Bar chart: Compares current vs. previous year’s net revenue by product mix or subscription option. Bars use solid color for the current period and a patterned overlay for the previous one. You can view monthly, daily, or yearly data. The x-axis shows combinations; the y-axis shows revenue amount.
Subscription Orders
Subscription orders is the number of subscription orders received as per different product mixes or subscription options.
In the In the Analyze > Multi-item dashboard, subscription orders can be displayed for:
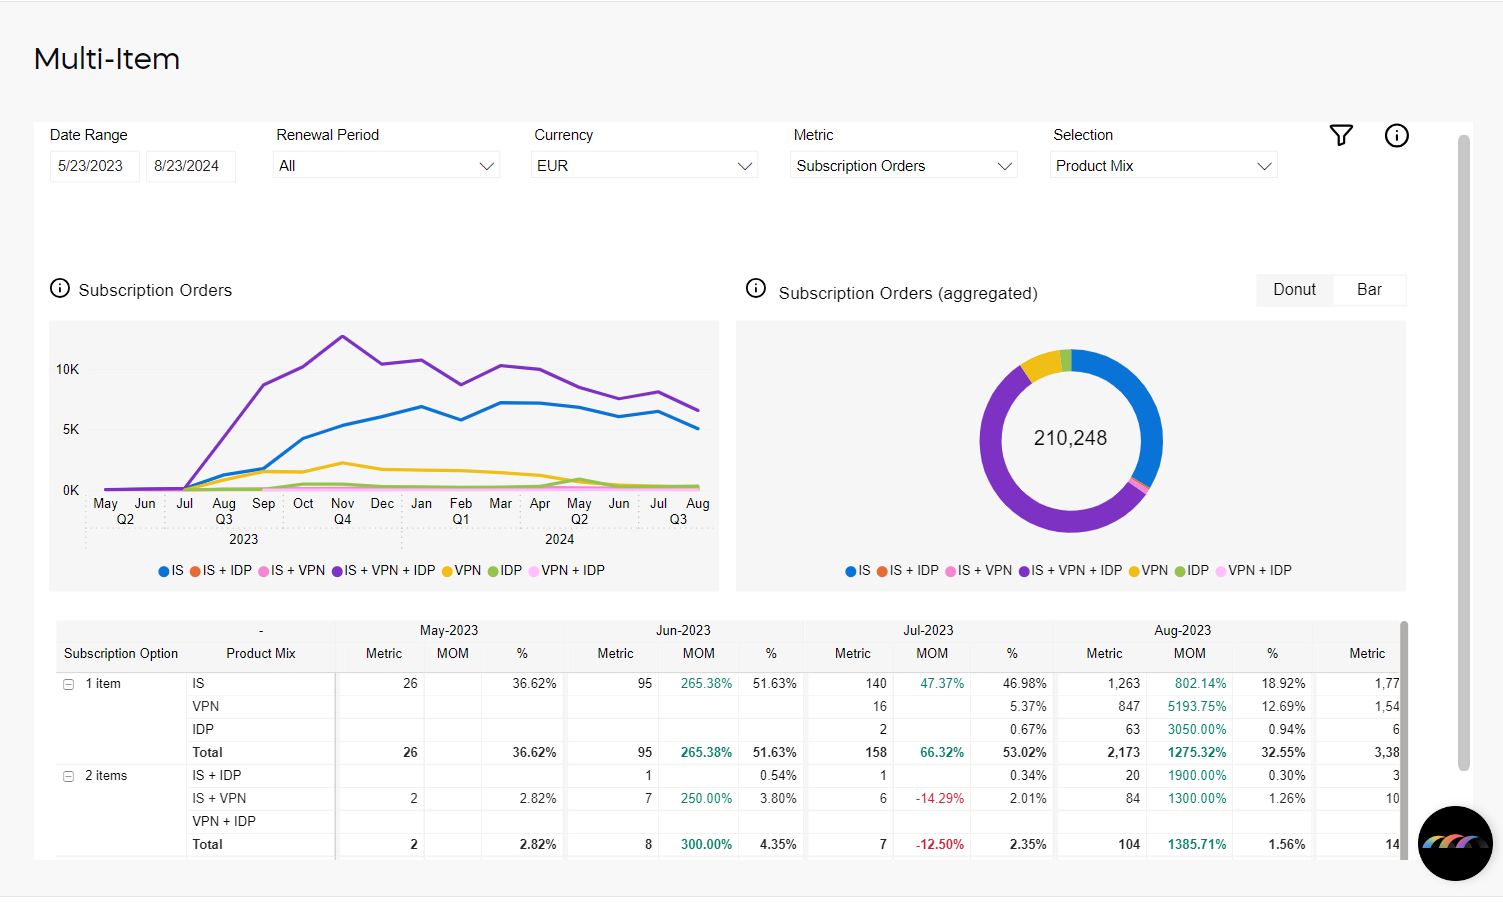
- Product Mix: Shows the number of subscription orders as per different product mixes.
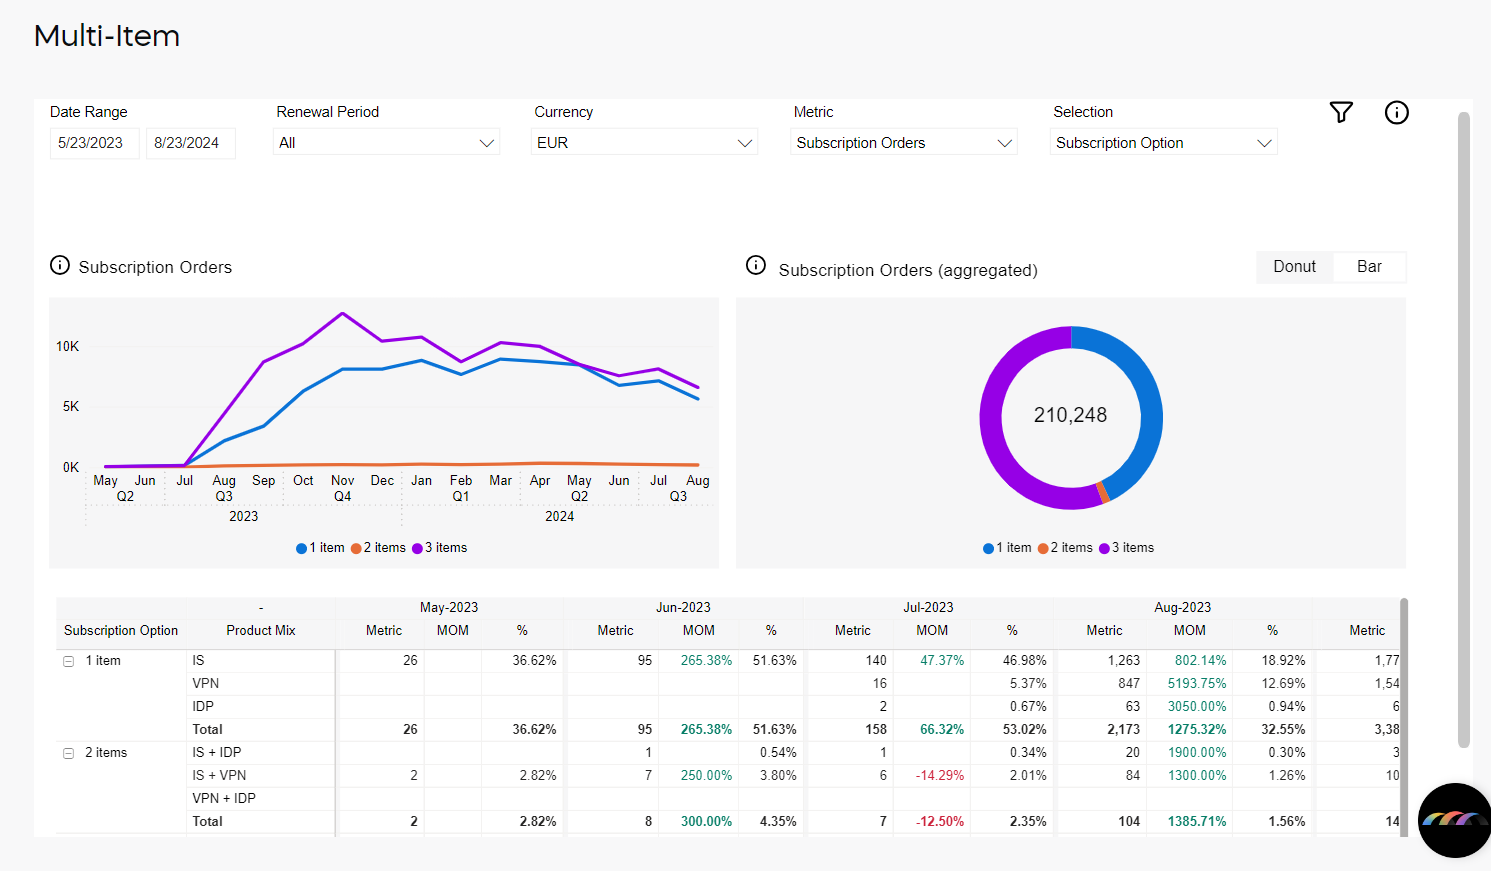
- Subscription Option: Shows the number of subscription orders as per different subscription options.
There are three ways in which the subscription orders metric is presented:
- Line chart: Shows subscription orders over time for specific product or subscription option combinations. You can view data monthly, daily, or yearly, and drill down for details. The x-axis shows the time period; the y-axis shows the number of orders.
- Donut chart: Displays the share of subscription orders by product mix or subscription option. Each segment represents a different combination. Hover to see more details and identify the most popular mixes.
- Bar chart: Compares current vs. previous year’s orders by product mix or subscription option. Bars use solid color for the current period and a patterned overlay for the previous one. You can view monthly, daily, or yearly data. The x-axis shows combinations; the y-axis shows order volume.
Filters
When working with multi-item analytics, the drop-down elements on the right-hand side and the filters on top of the metrics allow you to filter the results. The applied filters are visible above the charts and can be cleared with the X sign.
You can filter the data by:
-
Date Range: Month-day-year
-
Renewal Period: Monthly, yearly, or other subscription running periods
-
Currency: USD, EUR, or GBP
-
Metric: Net Revenue or Subscription Orders
-
Selection: Product Mix or Subscription Option
-
Subscription Option, Product Mix: 1, 2, or 3 item orders
-
Product: Name/ID of the product
-
Interval: Subscription item interval number
-
Payment Type, Subtype: Payment type and subtype used by a customer
-
Region, Country: World region as defined by Cleverbridge and billing country
-
APAC
- Australia
- China
- Hong Kong
- India
- Indonesia
- Japan
- Malaysia
- New Zealand
- Philippines
- Republic of Korea
- Singapore
- Taiwan
- Thailand
- Vietnam
-
EUROPE
- Albania
- Austria
- Belarus
- Belgium
- Bosnia and Herzegovina
- Bulgaria
- Canary Islands
- Croatia
- Cyprus
- Czech Republic
- Denmark
- Estonia
- Finland
- France
- Germany
- Greece
- Hungary
- Iceland
- Ireland
- Italy
- Latvia
- Liechtenstein
- Lithuania
- Luxembourg
- Macedonia
- Malta
- Monaco
- Montenegro
- Netherlands
- Norway
- Poland
- Portugal
- Republic of Moldova
- Romania
- San Marino
- Serbia
- Slovakia
- Slovenia
- Spain
- Sweden
- Switzerland
- Ukraine
- United Kingdom
-
LATAM
- Argentina
- Bolivia
- Brazil
- Chile
- Colombia
- Costa Rica
- Ecuador
- El Salvador
- Guatemala
- Honduras
- Mexico
- Nicaragua
- Panama
- Paraguay
- Peru
- Puerto Rico
- Uruguay
- Venezuela
-
NOAM
- Canada
- United States
-
ROW
- All other countries
-
-
Business Category: B2C or B2B.
-
Partner: Another business that buys your products in a B2B model. Partners purchase your products at a discount and then sell them to customers. Partners communicate directly with customers.
-
MVT: Multivariate testing campaign name/ID.
-
x-Parameter Class: These are your predefined x-Parameter classes. You can have a maximum of 5 x-Parameter classes per client in the system. When you select an x-Parameter Class filter, it is applied to the metrics and the x-Parameters under the x-Parameter class appears in the x-Parameter filter, which you can further select to filter the metrics. You can select either one x-Parameter class as a filter or all the available x-Parameter classes.
-
x-Parameter: x-Parameter represents origin of your revenue and subscription-metrics and there can be a maximum of 10 hierarchical x-Parameters levels in the system. You can select x-Parameter filters to see the subscription/revenue reports. You can either select one x-Parameter as a filter or all the available x-Parameters. For more information on x-Parameters, see Set up x-Parameters and Set up revenue tracking.
tipTo quickly find a specific campaign in a long list of entries in the x-Parameter field, use the search feature by typing in either the name or ID of the campaign for which you wish to filter the data.
-
Cart-Level Promotion: Promotion applied in the shopping cart.