How to create a report
To create a report in our Report Builder:
- Go to SCM and select Analyze > Report Builder.
- Select the date range: Define the reporting period.
- Select the metric(s): Select the values used in your report to measures performance, volume, or outcomes, such as revenue, active subscribers, conversion rate, or churn. Any number of metrics can be processed in one report.
- Apply filters: Optionally narrow down results to the segment you want to analyze (for example, a specific product, country, or payment type).
- Choose the dimension(s): A dimension is a descriptive attribute that can be deemed as a category used to group and break down your metrics. Dimensions determine how results are aggregated and displayed in the report. Only four dimensions can be added to one report.
- Fine-tune the report: Use the table settings to choose the key dimension, the metric used for ranking, and the number of rows displayed.
- Run the report: The report will represent metrics calculated for the date range you select and broken down by the dimensions you added, so that you can compare results across categories.
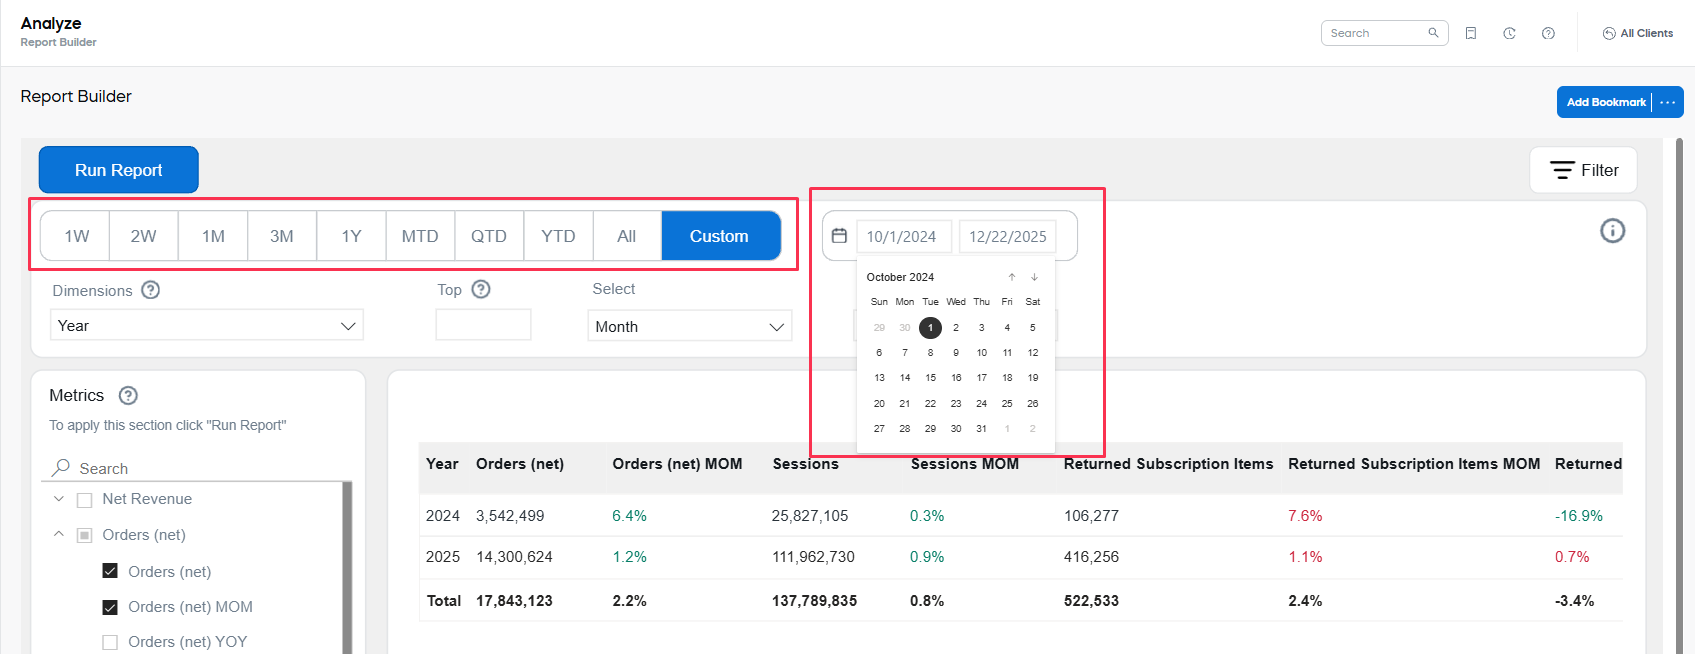
Select the date range
Use date-range selectors at the top of the page.
Select the metrics
Metrics are the numbers you want to measure, such as revenue, churn, or conversion rate. Some metrics are used in the both Analytics dashboards and some are unique for the Report Builder. See the full list of available metrics
Find a metric
To find a specific metric, type it name or part of it in the search field. Check or uncheck the boxes to add a metric to the report. 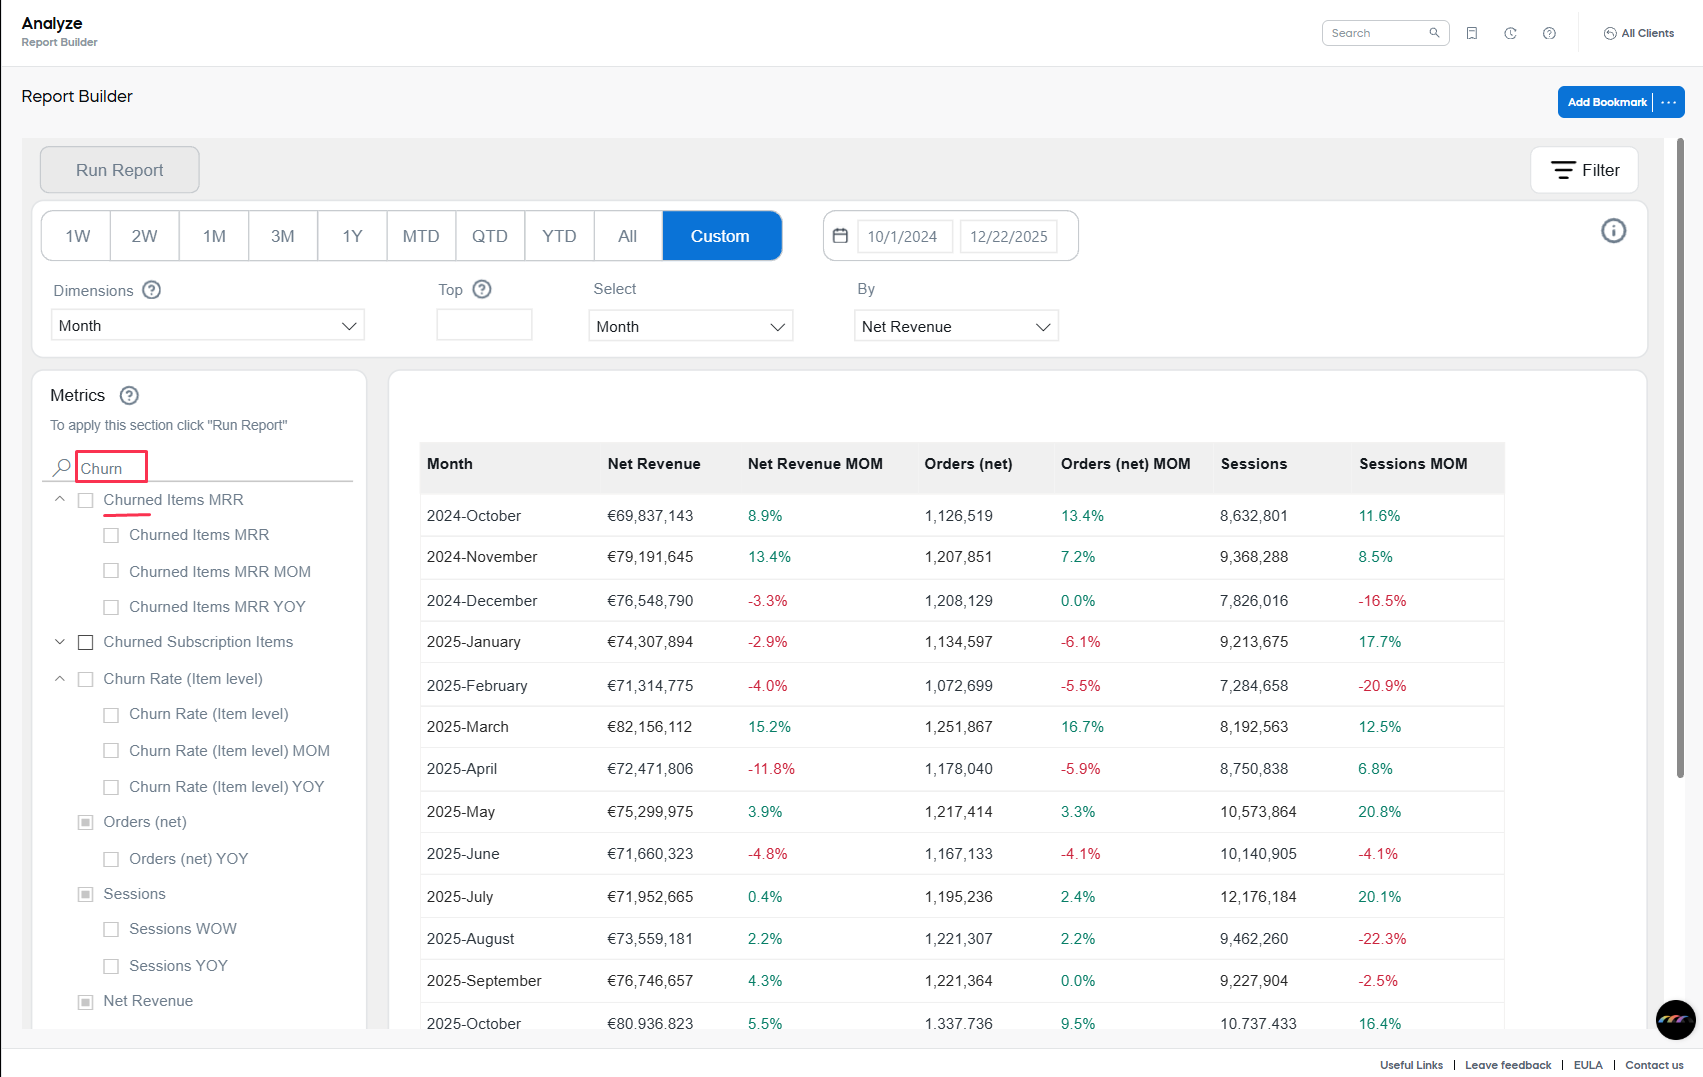
The Search field filters the metrics list. If you enter a keyword, you’ll see only the metrics that match your search. Any metrics you already selected (checked) are still included in the report, even if they don’t match the current search.
To review all selected metrics, clear the Search field.
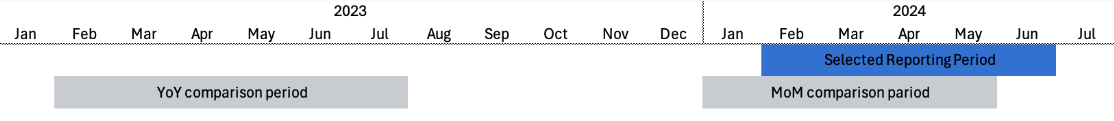
MoM ana YoY metrics
- MoM and YoY metrics are calculated as follows:
- MoM is a comparison of the reporting period with the reporting period of the same length starting one month ago.
- YoY is a comparison of the reporting period with the same period one year ago.
Apply filters
Filters narrow down the data included in your report. They let you focus on a specific segment (for example, one product, specific countries or payment methods) without changing how results are grouped. Basically, filters limit which records are included in the calculation of your metrics and apply to the entire report output.
To apply a filter you need to select a filter it and apply it to the report. These can be:
- Built-in filters: Standard filters with selectable values (for example, client, country, date range).
- Text search filters: Free-text filters where you enter comma-separated values and choose whether to include or exclude matching records.
You can filter the report by the following fields:
- Client: Limits results to one or more client accounts (useful if you have access to multiple clients).
- Currency: Limits monetary metrics to a selected currency (for example, EUR).
- Product: Limits results to one or more specific products.
- Product list: Limits results to a predefined product list.
- Recurrence: Limits results by purchase type, such as initial purchases versus renewals.
- Renewal period: Limits results by renewal cadence or term (for example, monthly or yearly), depending on your subscription setup.
- Item interval: Limits results to specific subscription intervals (for example, interval 0 for initial purchases).
- Payment type, subtype: Limits results by payment method and, if applicable, a more detailed payment subtype.
- Region, country: Limits results by geographic region or country.
- Business category: Limits results by B2B or B2C classification.
- MVT: Limits results to a specific multivariate testing (MVT) campaign or variant.
- Partner: Limits results to a specific partner or partner channel.
- X-parameter class: Limits results to a specific x-parameter category (used for URL-based segmentation).
- X-parameter: Limits results to a specific x-parameter value (captured from the URL for segmentation).
Choose dimensions
Dimensions are the categories you use to split those numbers, such as product, country, or month.
Select up to four dimensions for your report from the Dimensions selector on the left, below the date selector. 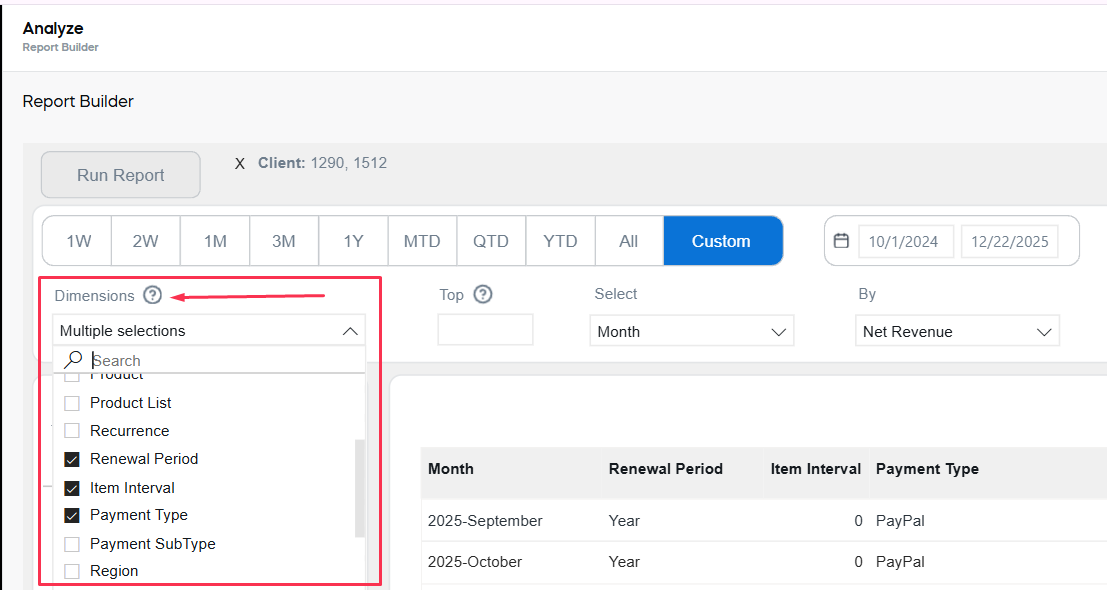
See the full list of available dimensions
Adding more than four dimensions will result in an error.
Dimension limitation
Some metric–dimension combinations are intentionally unavailable because the breakdown would not be meaningful or interpretable. For this reason, Report Builder restricts these pairings and supports only dimensions that align with the metric’s definition and context.
A corresponding error message is implemented to make sure that users are aware of the incompatibility.
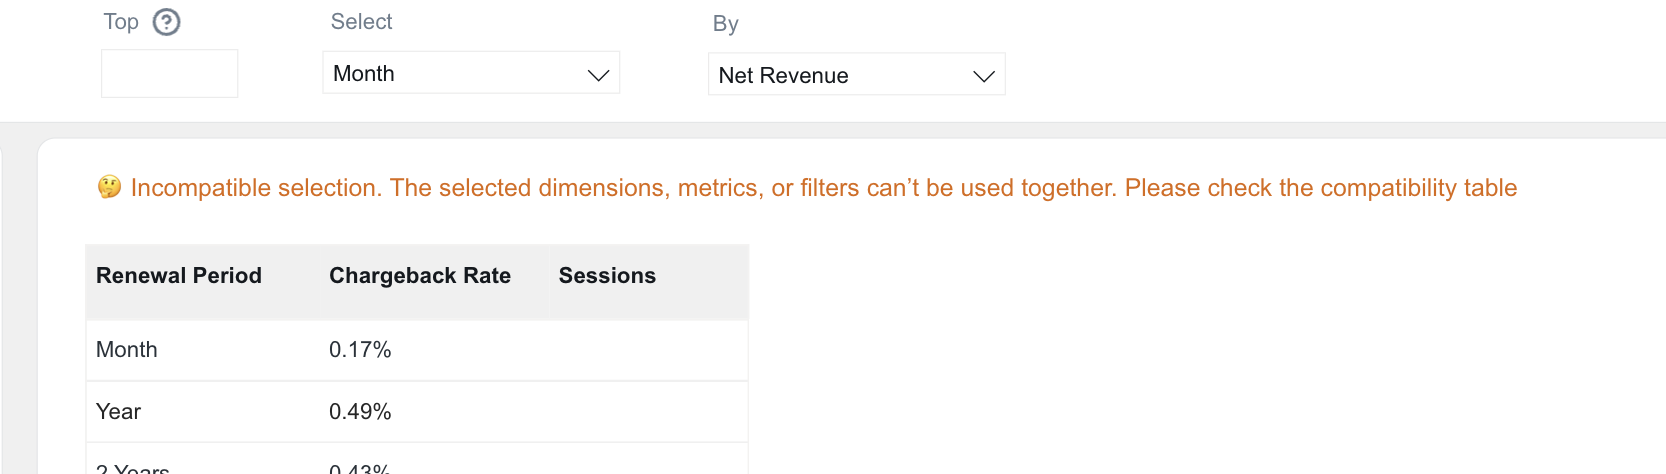
You can use this page to check what dimensions can be applied to a chosen metric, view and download the full compatibility matrix, lists of all dimensions applicable to a metric, and all metrics compatible with a dimension.
Fine-tune the report
Use the table settings to the right from the Dimensions selector to choose the key dimension (Select), the metric used for ranking (By), and how many rows to display (Top N).
Select and By
These two values are defined by default and can be adjusted:
- Select: Choose the key dimension that the table rows represent (for example, Client or Month).
- By: Choose the metric used to rank those rows (for example, Net revenue or Orders).
For example, if Select = Client and By = Net revenue, the table lists clients from the highest net revenue to the lowest; if Select = Month and By = Orders, the table lists months from the highest number of orders to the lowest.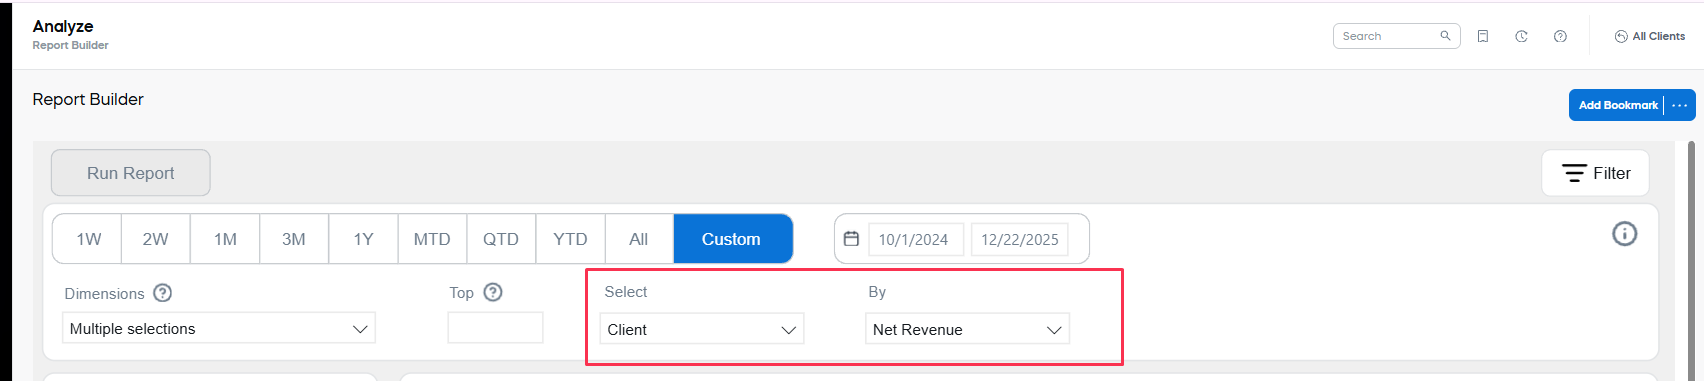
Top
Use the Top setting to limit the table to the top results for the applied Select/By pair. The setting is by defined empty, and all rows are displayed.
Regardless of this settings, the table columns that correspond to the selected dimensions and metrics appear in the generated report in the same order as they were selected from the respective drop-down lists.
Run the report
As soon as you have updated any of the metrics or dimensions, the Run Report button becomes active. If the Dimensions, Select, or By settings have been updated, the clock icon will appear next to them.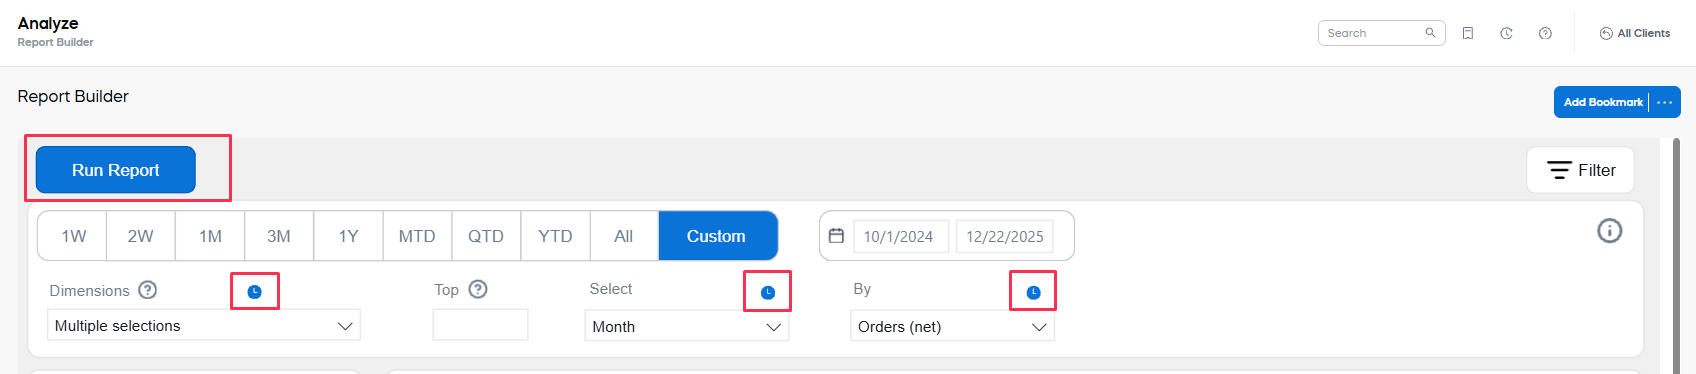
Whenever the Run Report icon is active, the report on the screen is the previous version of your report (with previously applied settings).
Use report results
Use the menu (...) in the top-right corner of the results area to export, switch views, and adjust sorting. 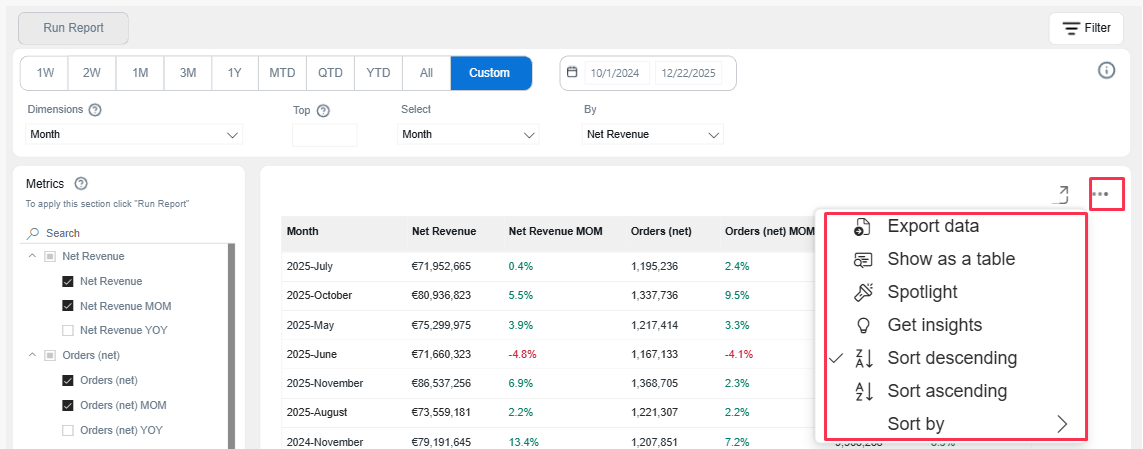
- Export data: Download the current report output in a supported format. Exports reflect your selected date range, metrics, dimensions, filters, and table settings.
- Show as a table: Switch the current view to a table so you can scan, sort, and export rows more easily.
- Spotlight: Highlight a selected value or series to focus on it in the current view (availability depends on your current view and selection).
- Get insights: View automatically generated insights for the current selection (availability depends on your current view and selection).
- Sort descending: Sort the table from highest to lowest based on the selected column.
- Sort ascending: Sort the table from lowest to highest based on the selected column.
- Sort by: Choose which column to use for sorting, and then apply ascending or descending order.