Acquisition dashboard
The Acquisition dashboard is a tab in the Business Review section. It helps you understand how effectively you convert traffic into paid purchases, with a focus on growing Revenue per Visit (RpV).
To ensure conversion rates are comparable and accurate, the dashboard data is based on initial subscription purchases at interval 0 and non-recurring purchases that have corresponding sessions.This means that it excludes additional interval 0 purchases (such as upsells or expansions) and signups created via API calls. It includes only purchases completed through the standard checkout flow, where session tracking ensuring a fair conversion calculation.
Access the Acquisition dashboard
Go to the Analytics section of SCM and select Business Review from the menu. Then select the Acquisition tab.
You can also open it directly using the Acquisition dashboard link
If you don’t see the dashboard, reach out to your Client Experience contact to request access.
Information available on the Acquisition dashboard
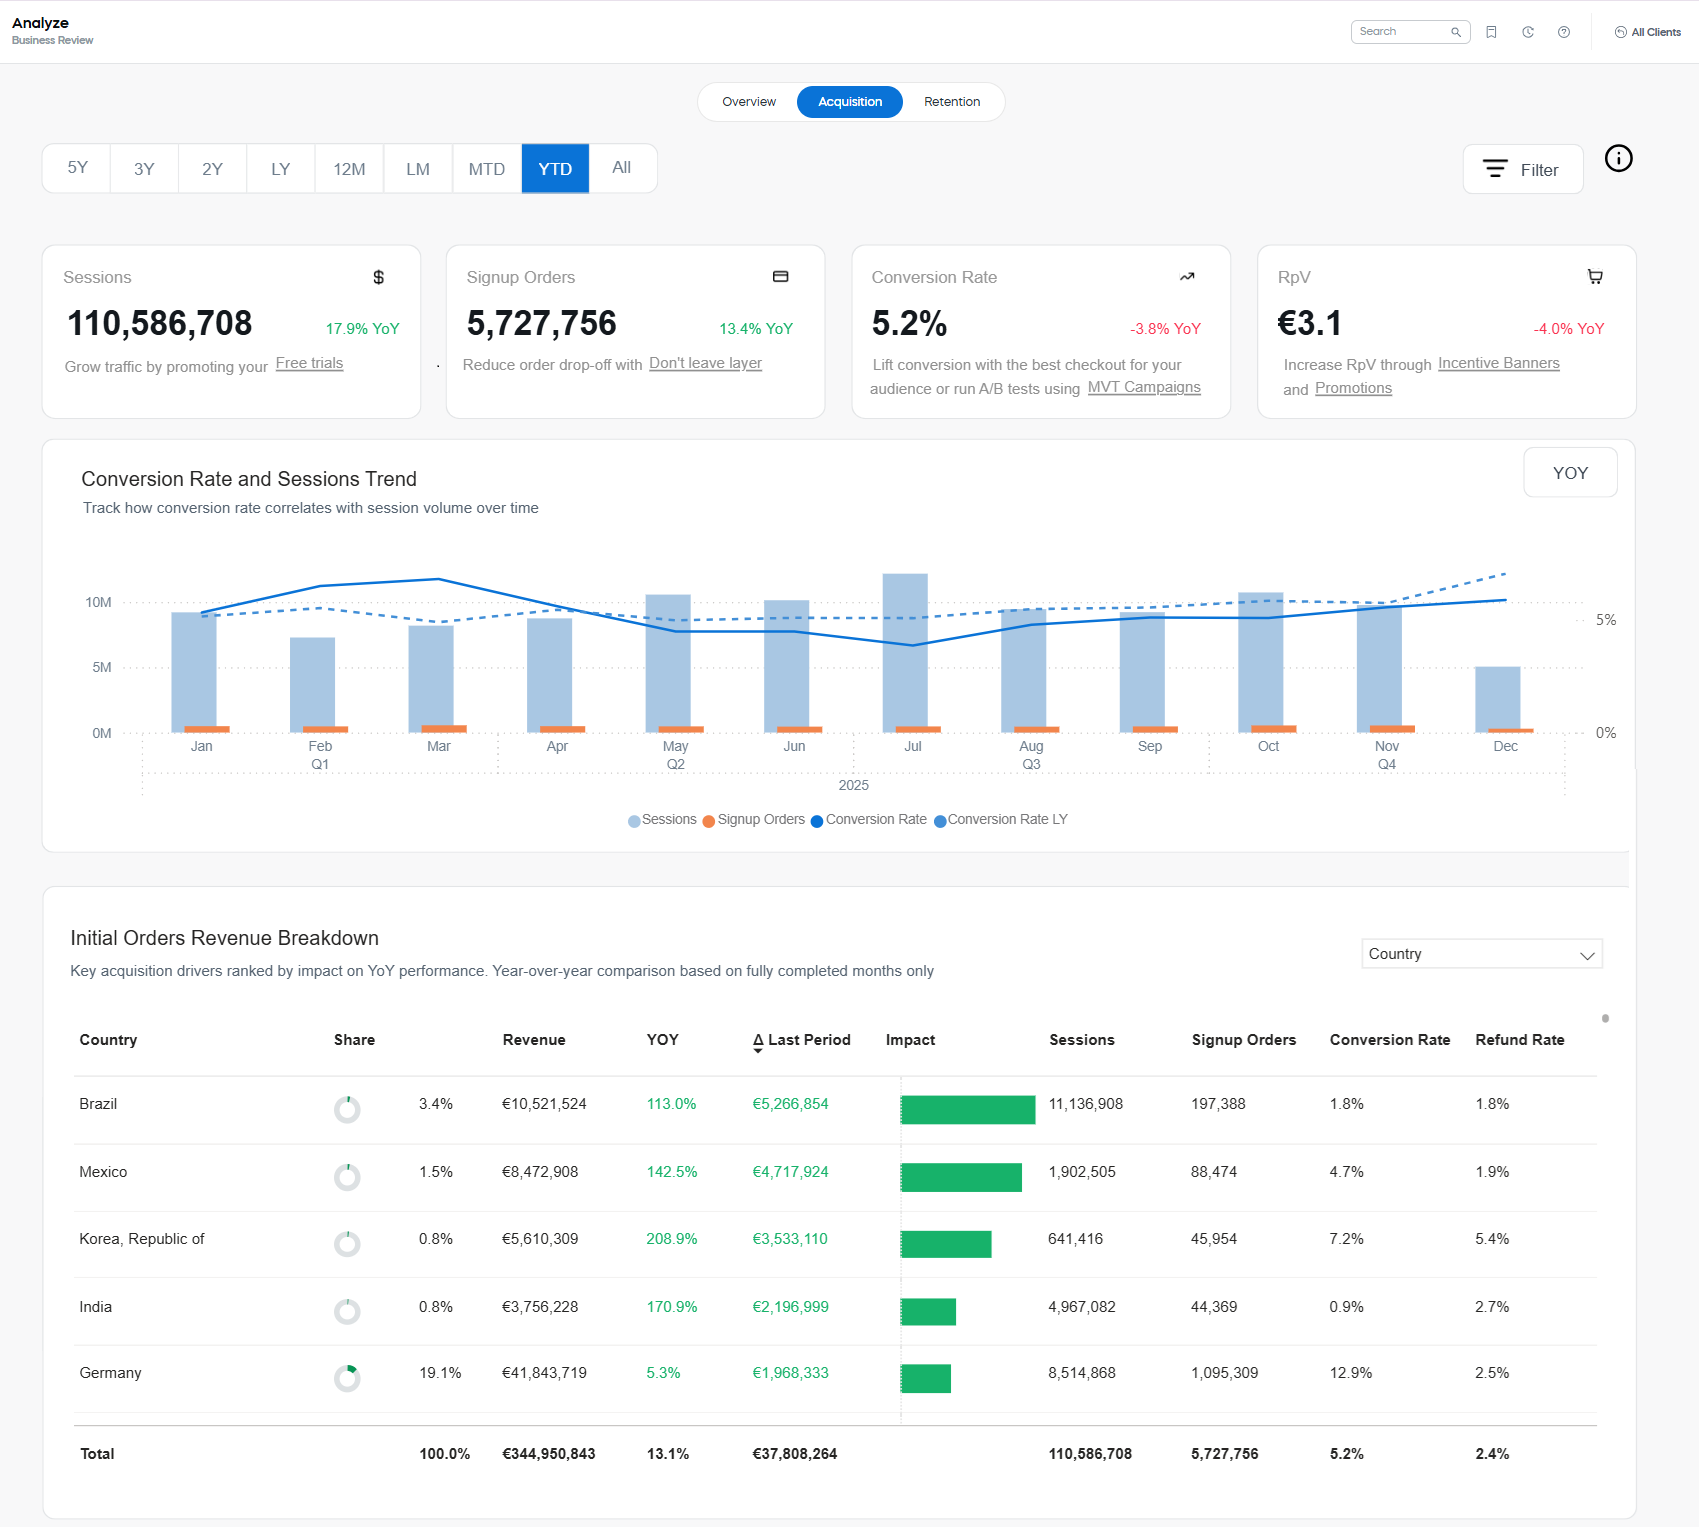
The page contains a date picker and Filters panel. Below them, there are three main areas: Key metrics, Conversion Rate and Session Trend analysis, and Initial Orders Revenue Breakdown table.
Filter and date picker
Use the Filter panel to narrow the view (for example, by geography, product scope, or promotion context) and to focus your investigation on the most relevant segments. The dashboard supports main SCM filters and sorting tools. However, there are more years than in other SCM reports, enabling long-term trend analysis (up to 5 years of history).
Use the date picker to access up to five years of historical data. If the range you need isn’t available in the quick presets, use the Month Range setting it in the Filter panel.
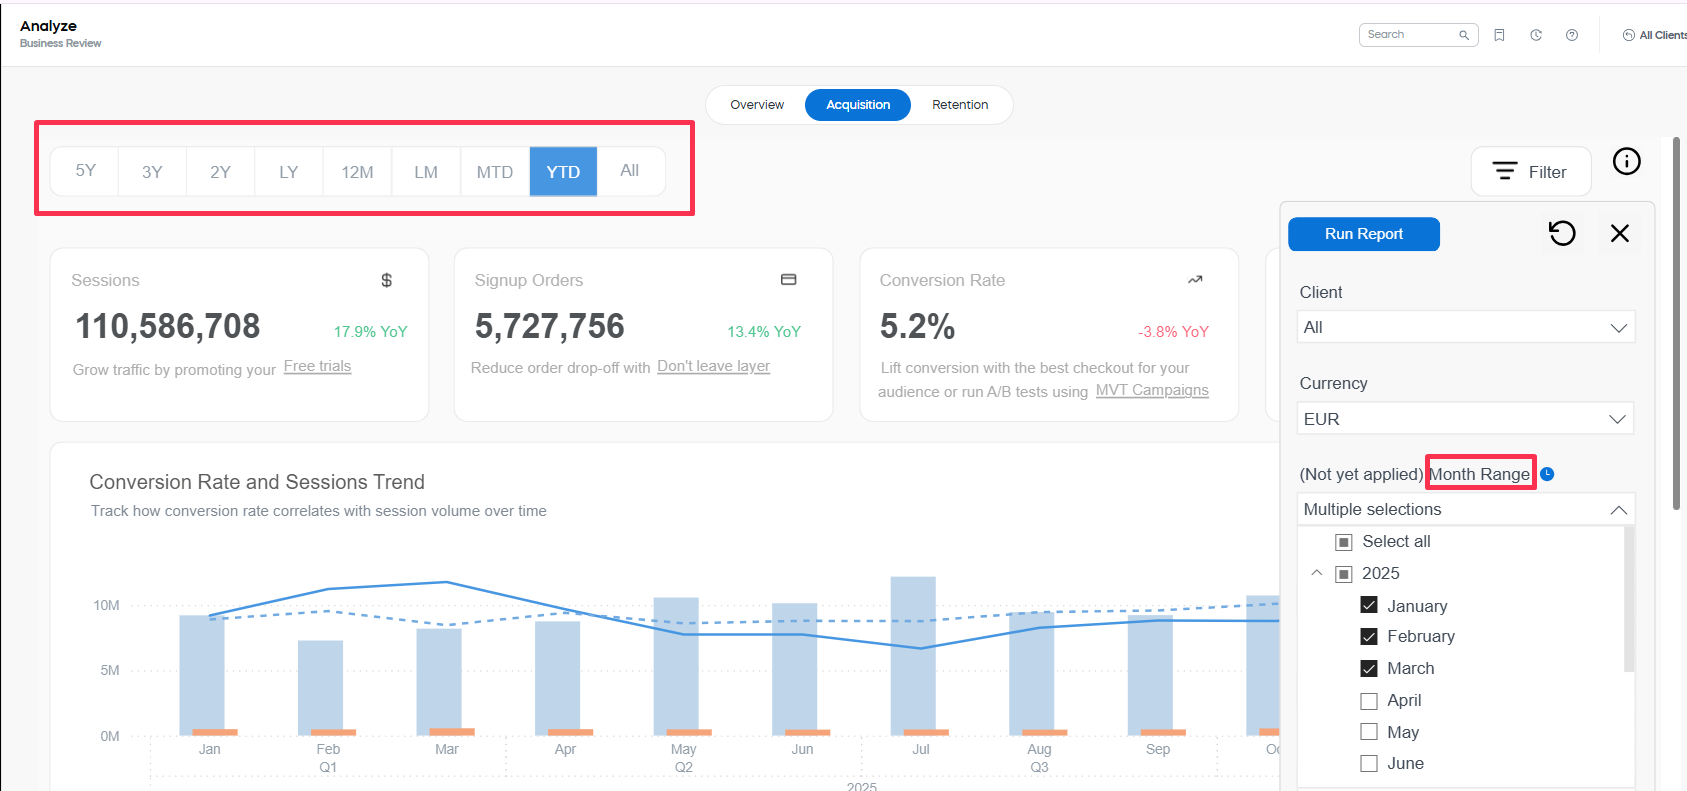
Once you've defined the set of filters, click the Run Report button at the top of the Filter panel. The settings will be applied to all the metrics, tables and representations available on the dashboard.
Key metrics
At the top, KPI tiles summarize the most important acquisition metrics with YoY indicators and quick guidance.
- Sessions: The number of customer sessions (visits) in the selected period.
- Signup Orders: The number of initial orders created from sessions in the selected period.
- Conversion Rate: The share of sessions that resulted in a signup order. (See Conversion Rate)
- RpV: Revenue per visit, shown as net revenue relative to session volume.
Colored YoY value next to each KPI shows the change versus the same period last year. Green indicates an increase, and red indicates a decrease.
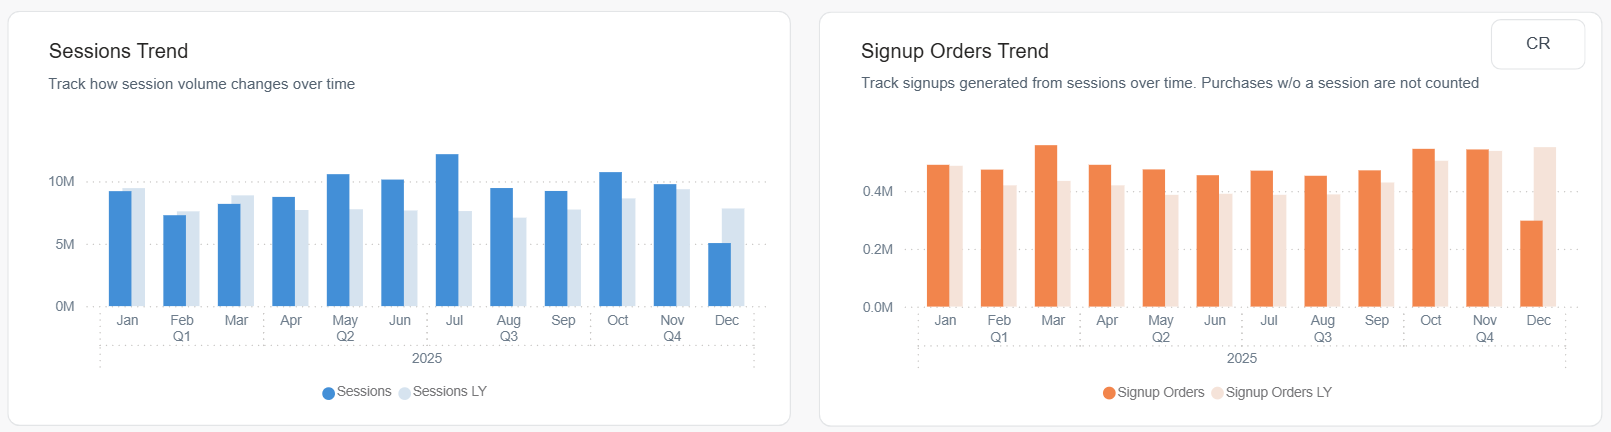
Extend key metrics
Every key metric can be expanded to review details with trend line. 
The graphs correspond to those available in the corresponding sections of the Subscription Analytics. For example, these are Sessions Trend details:

Conversion Rates and Session Trends
The section provides trend visuals to understand when performance changed and whether it is driven by traffic volume, conversion efficiency, or both.
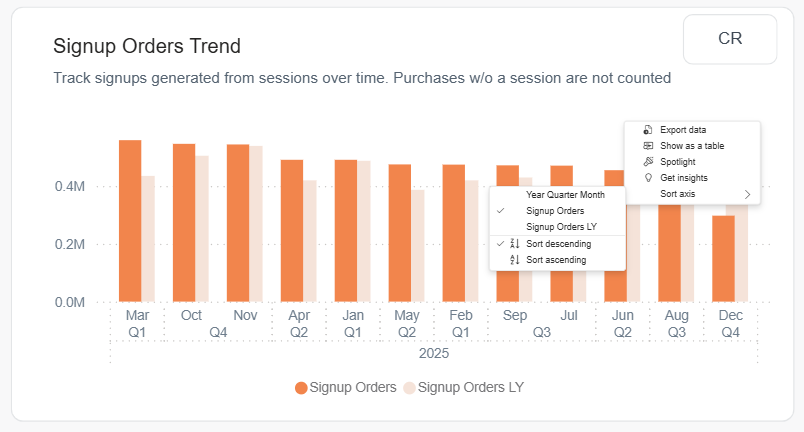
Conversion Rate and Sessions Trends representation
This visual, displayed by default below the key metrics, helps you see how conversion rate correlates with session volume over time.
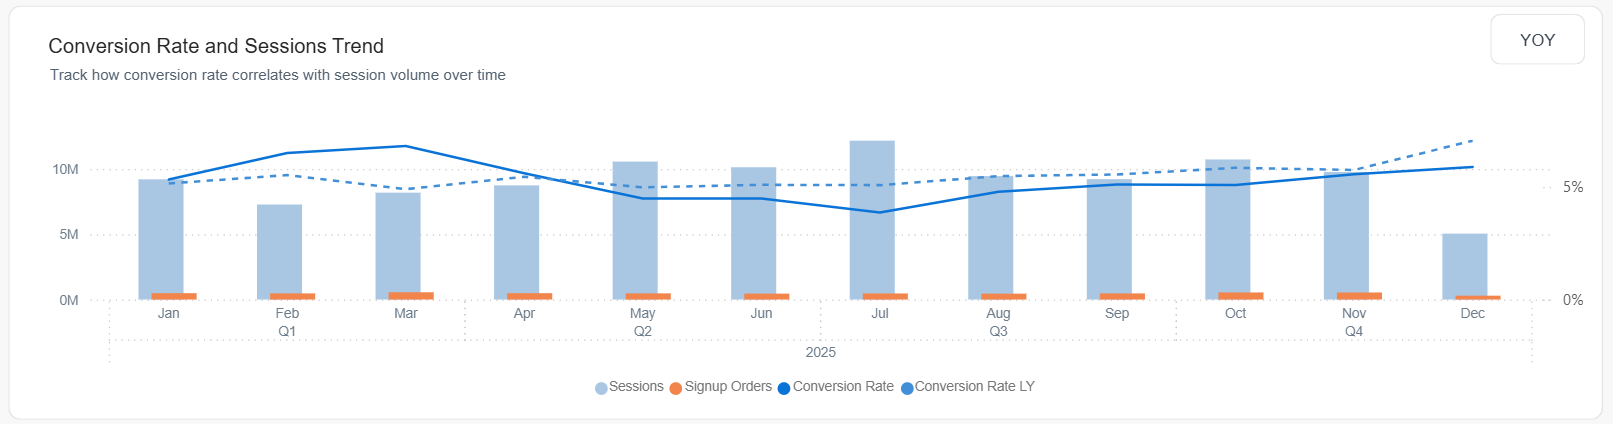
- Bars show (if available) the monthly values for Sessions and Signup Orders.
- The lines shows Conversion Rate this year and in the corresponding period last year.
Conversion Rate and Sessions Trend YoY representation
You can also use the YoY toggle to compare each of the metrics against last year.
Right-click any visual to view or copy the underlying data, and to access additional analysis options.
Initial Orders Revenue Breakdown
This report highlights which segments had the largest impact (positive or negative) on acquisition performance, helping you quickly identify drivers to investigate.
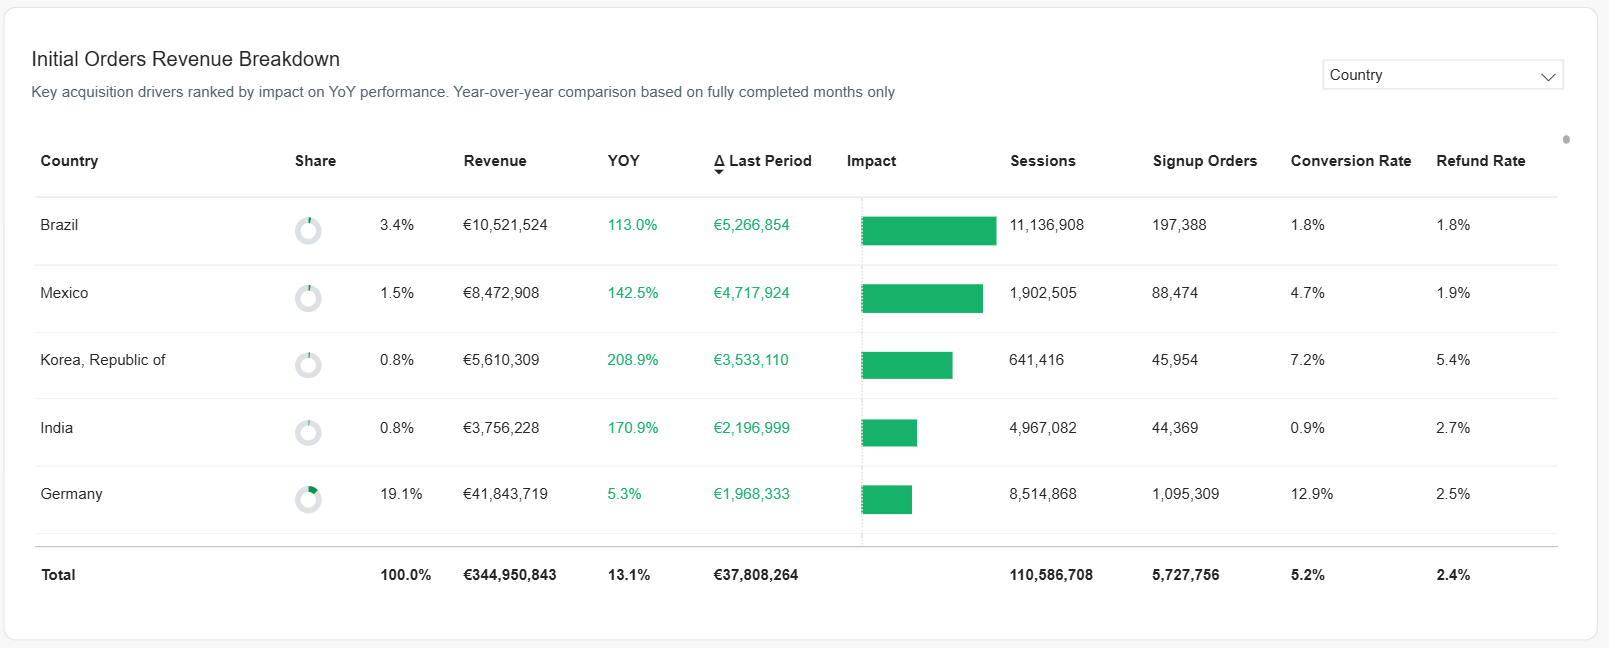
YoY comparison is based on fully completed months only.
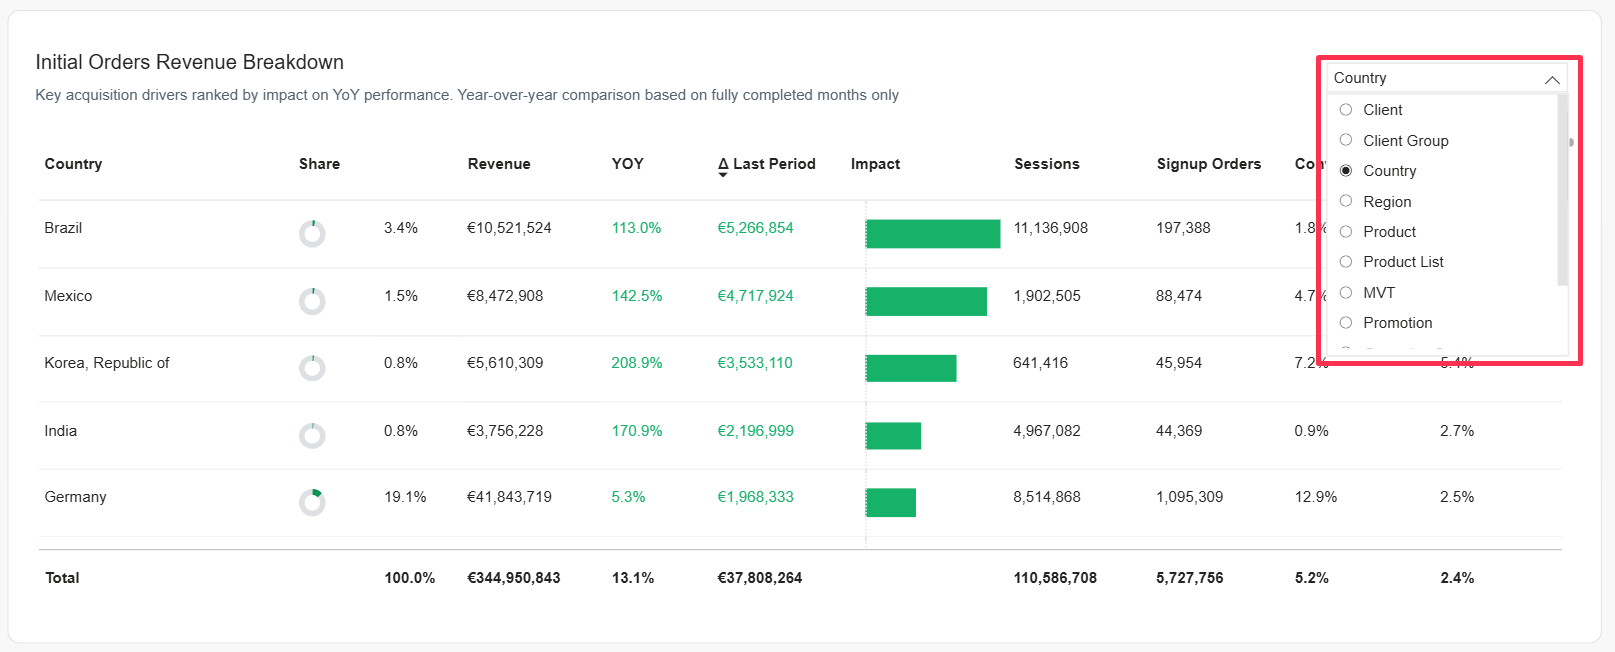
Dimension
At the top right of the report area, select the dimension you want to analyze.
Switching dimensions helps you compare segments side-by-side (for example, countries, products, or promotions) to isolate growth drivers, spot conversion or refund issues, and quantify each segment’s impact versus the last period.
The following values are available:
- Client: A specific company/account whose commerce runs through Cleverbridge.
- Client Group: A logical grouping of clients (e.g., brand family, business unit, partner cluster).
- Country: The customer’s billing/transaction country.
- Region: A broader geographic area composed of multiple countries (e.g., North America, EMEA).
- Product: An individual catalog item/SKU.
- Product List: A curated set of products (e.g., a suite, plan family, promotional bundle list).
- MVT: The multivariate testing segment that applied to the customer’s experience (for example, a test campaign, routing, or variation).
- Promotion: The promotion applied to the initial order (for example, a promo offer, or discount).
- Operating System: The customer's device operating system (for example, Windows, macOS, iOS, or Android).
- Browser: The customer's browser type (for example, Chrome, Safari, or Edge).
- Language: The language of the customer’s session (based on browser, or storefront localization settings).
Session-based dimensions (for example, Operating System, Browser, and Language) reflect the customer’s device and session context, and may differ from billing or account-level data.
You can also use the Filters panel to narrow the view by Country/Region, Client/Client Group, Payment Type/SubType, etc.
Other table columns
Based on the selected dimension, you can see the break-down for the following values.
- Share: The segment’s portion of total revenue in the current view.
- Revenue: Net revenue for the segment in the selected period and filters.
- YoY: Year-over-year change for the segment over completed months in the selected period.
- Δ Last Period: Absolute change vs. the immediately preceding comparable period within your current date range.
- Impact: A visual indicator of how much this segment contributed to the overall change in the dashboard view.
- Sessions: Sessions attributed to the segment.
- Signup Orders: Signup orders attributed to the segment.
- Conversion Rate: Conversion rate for the segment.
- Refund Rate: Refund rate for the segment.
Initially, the items are ordered by Impact (Δ Last Period), so the largest movers appear first. You can sort by other columns to tailor the table to your analysis.